The question of how to draw a fiber optic splice sheet has haunted mankind for a long time. And this is not the only important question about fiber splicing. Just as important is the question of how to do it correctly. Since there was no clear answer anywhere, people armed themselves with a pencil. Now that they know roughly what to draw, everyone is looking for an answer – and in which program can you draw a fiber splicing sheet (or splicing diagram, or splicing matrix)?
Discussions in internet forums are still alive and the search does not stop. I can remember myself taking part in such internet discussions in the mid-2000s. Not much has changed since then. Looking ahead, I would say that people are using absolutely every possible program to draw fiber splicing – all kinds of graphic editors, vector and raster, flowchart editors, spreadsheet and even text editors. Yes, I have often been sent fiber splicing sheets, or something remotely resembling fiber splicing, in both Word and Excel.
With no consensus, people are now asking how to draw splice sheets quickly. Quickly and conveniently, in large amounts. Let’s leave this question for a moment and let me tell you how I went about it myself.
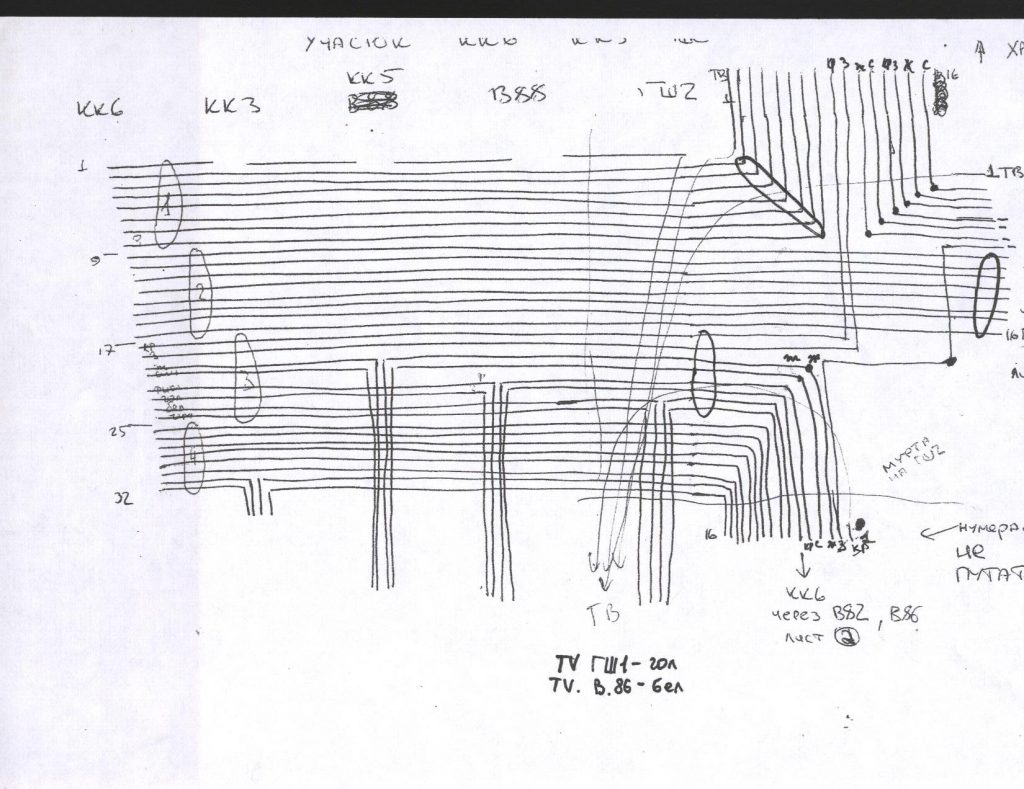
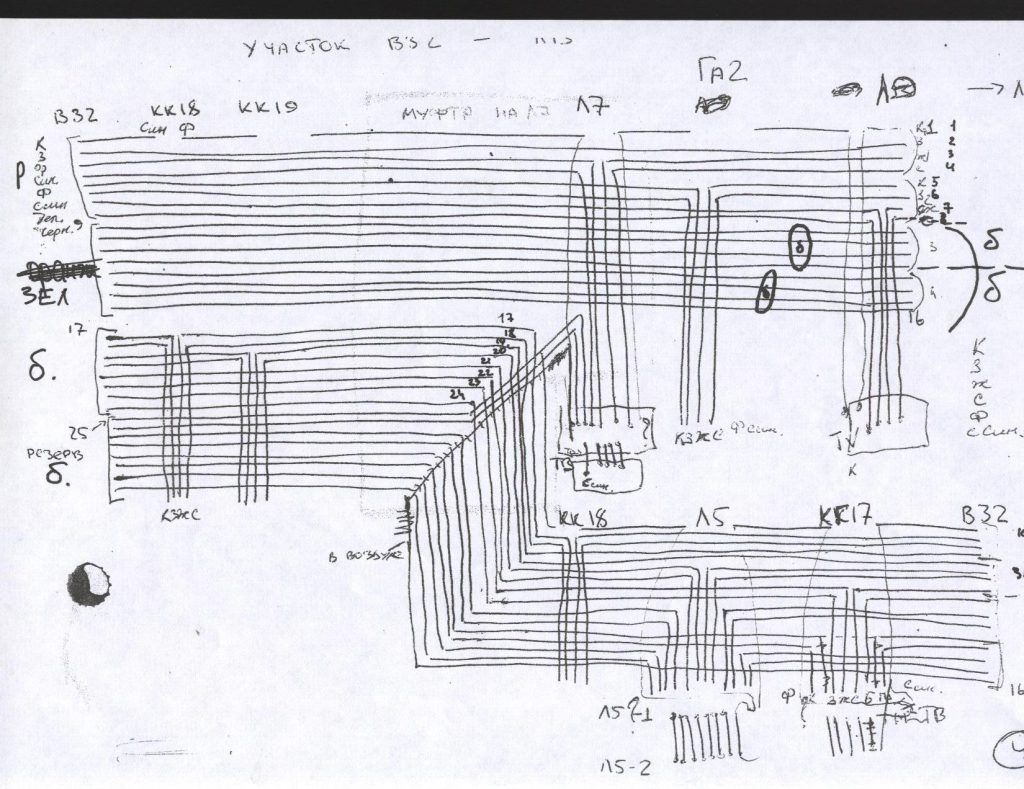
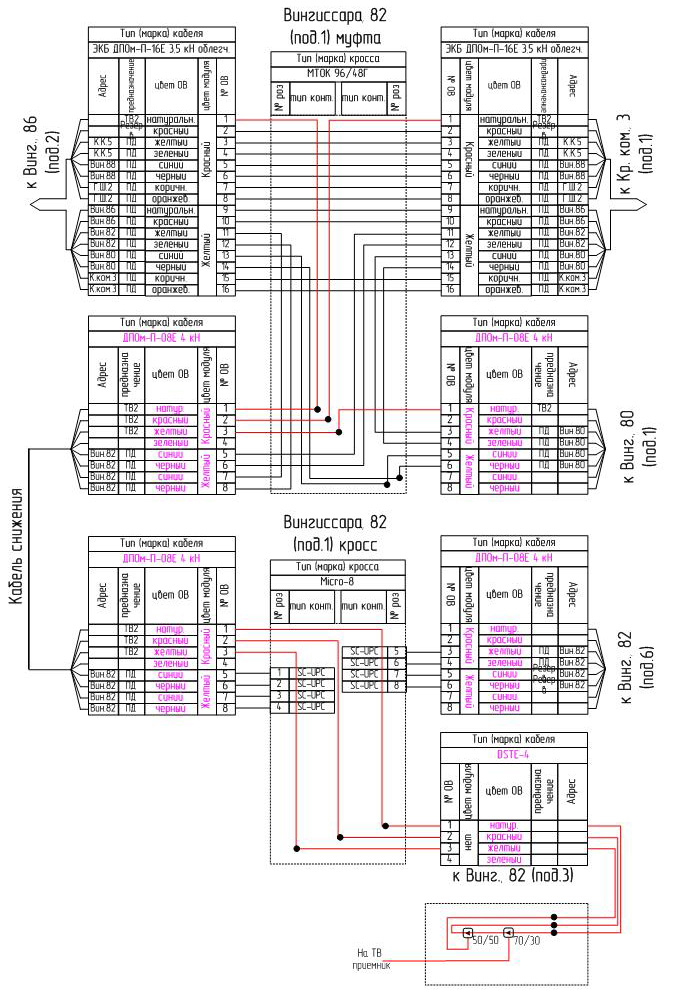
When I started working as an engineer in 2005, most of my company’s customers handed me splicing sheets that looked like this:
My job as an engineer was to convert those drawings into electronic documents. You’ll laugh, but we did it in Excel. Nobody knows why we did it that way. I think we found or stole a fiber splicing template somewhere in that format and, not knowing anything better, we did it in Excel. One file – one cluster, one tab – one node. Needless to say, it was a painful, repetitive job in each tab, with lots of errors. Unfortunately, no examples of this horror have survived.
At about the same time, after studying MS Visio 2003, we copied the appearance of those templates and started making them in MS Visio. It seemed more logical, but it is clear that it did not bring any gain in speed, convenience or error reduction.
It looked something like this:
Why are there so many sockets? Someone came up with the idea of splicing all the unused fibers into sockets so that they could be switched with patchcords when needed. I still feel ashamed for some decisions. Why so many fiber splitters? At the time, digital cable TV was booming and was the dominant service in the optical networks being built. Data transmission was more of an additional service and opportunity for the operators. A large number of operators at that time built fiber optic networks exclusively for TV transmission.
All in all, the starting point is not the worst. Especially when you consider that the only government regulation obliged making splice sheets according to this template:
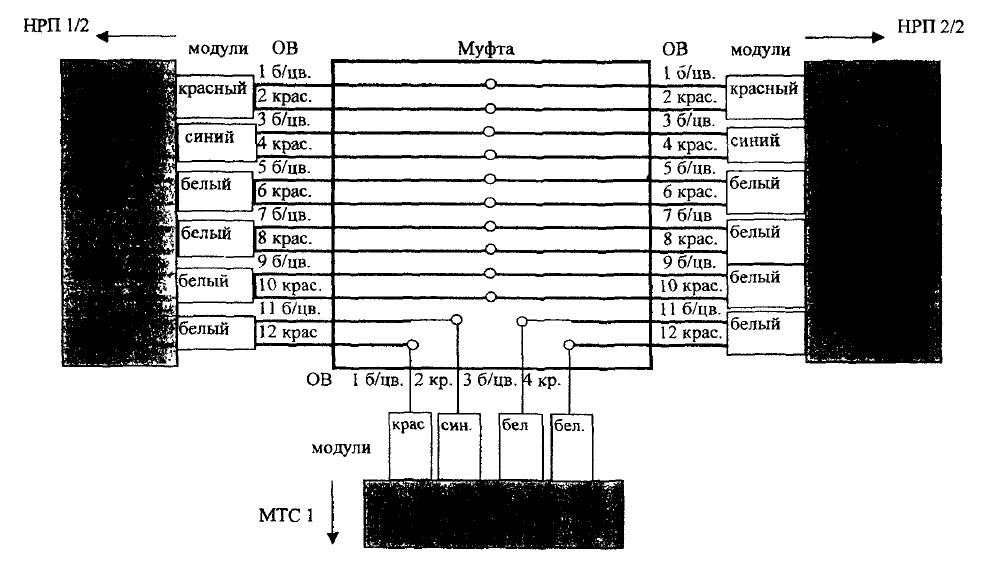
The standard dates back to 2000 and has never been updated since. It’s been a quarter of a century. I can see where it came from. This and similar normative schemes come from the schemes for switching copper cables in cross-country automatic telephone exchanges.
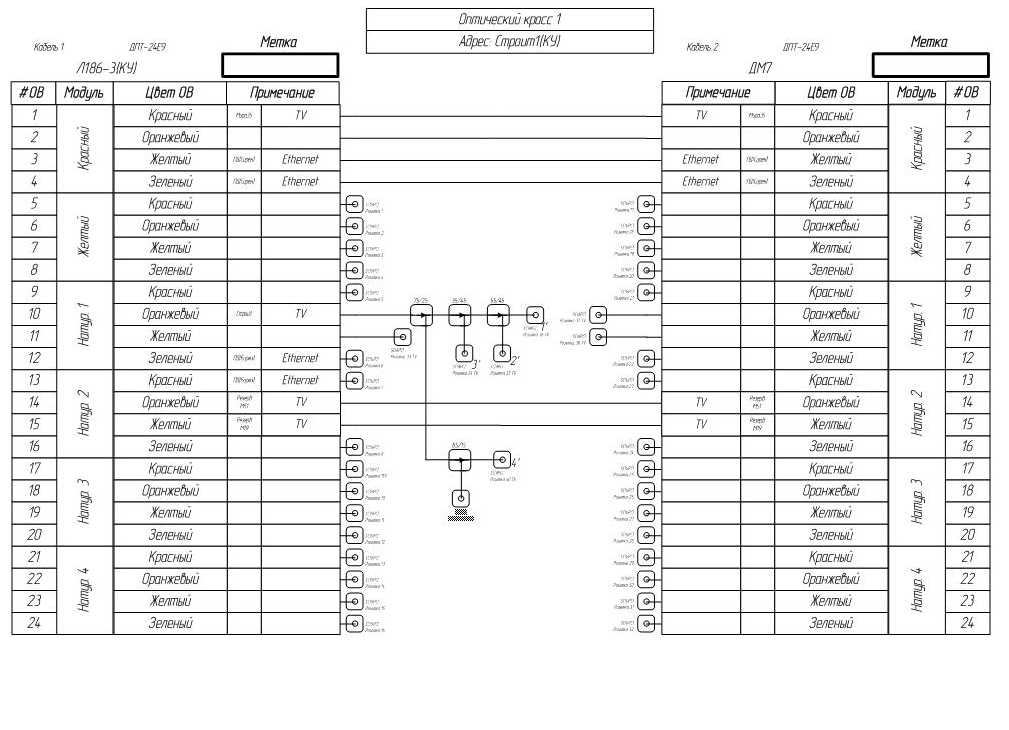
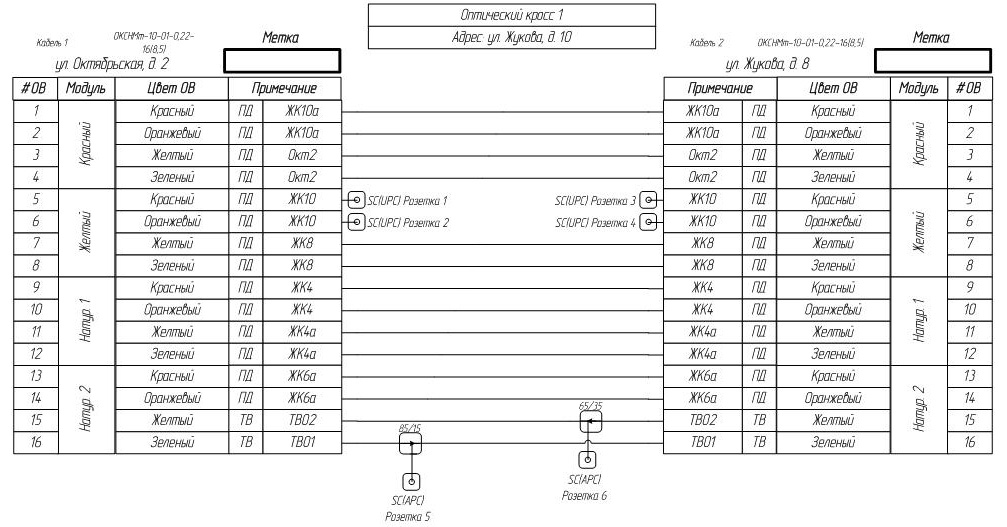
Getting back to our schemes, this has been going on for quite a long time. Work on larger projects forced some changes.
We started making fiber splicing diagrams in this form in 2009. Of course, we could have done it earlier. Here, the template of the cable itself had been competently finalized, flexible connectors were used in MS Visio for connections. A cassette appeared, along with readable sockets, the ability to highlight individual fibers in colour. For some reason several nodes were placed on one page, apparently to save paper. Of course, there was no automation at all, everything was a long way off. But at least it was less embarrassing. But the most interesting thing is that because of habit, laziness and inertia, and also because not everyone knew how to use MS Visio well, many subsequent projects were still done by our engineers in the old form. This is the old form:
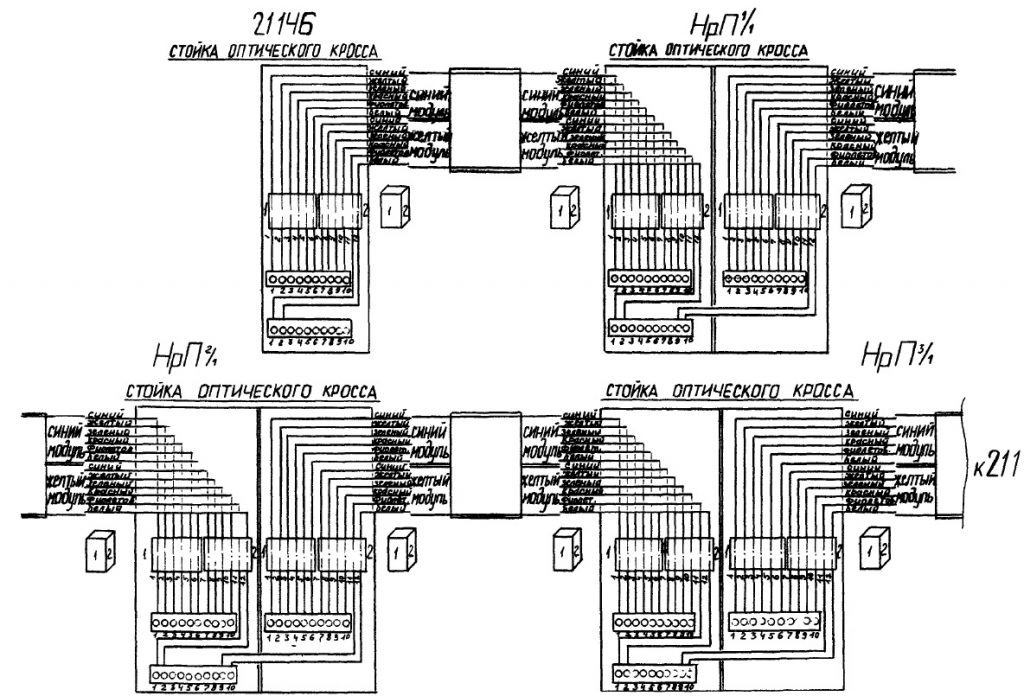
Around the same time, in 2009, we made our first attempts to draw fiber splices for large network sections at once, i.e. a large number of splicing diagrams on one sheet. Previously, we would take a sheet of paper and draw splicing of a node on it. This is how we came up with the concept of “bedsheets”. From a distance it looked like this:
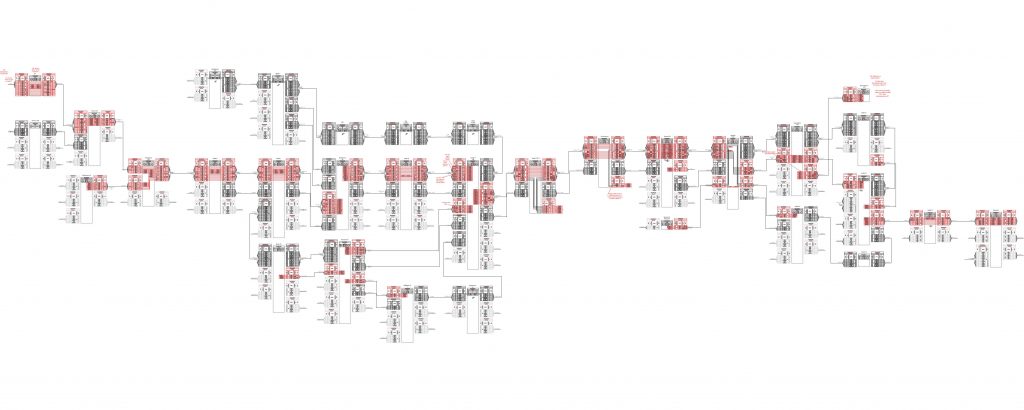
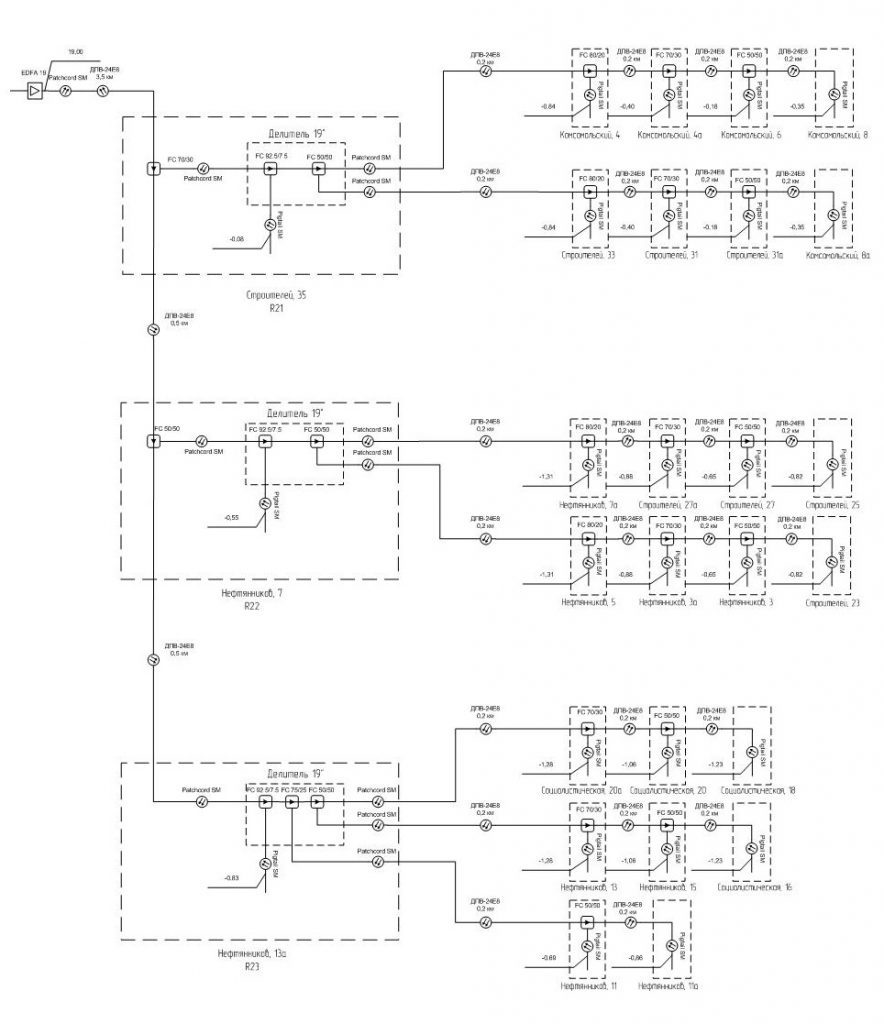
It didn’t look good, it was unreadable and uninformative, and it caused constant confusion and errors. It took a long time to produce and was difficult to edit. But it felt necessary, and it had to be improved somehow. Just as always we simply lacked time for that. But at the same time we learned how to manually construct a logical scheme for optical TV signal distribution, and how to calculate signal attenuation in the network. It was a huge achievement at the time, and it looked pretty good. But of course it was a huge amount of work.
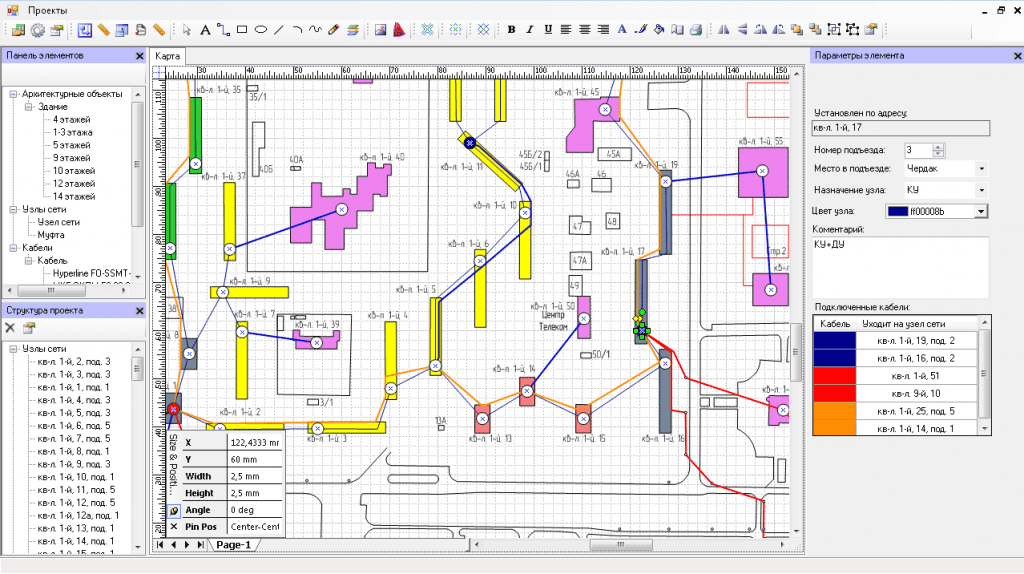
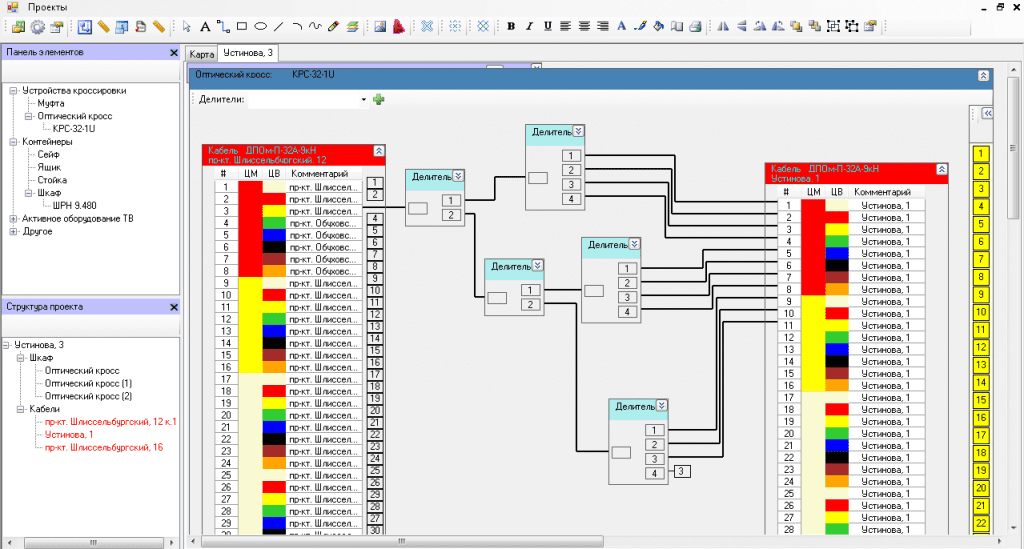
I don’t remember exactly, but somewhere in 2009-2010 we made an attempt to get away from all the graphical editors and write a separate software for designing optical networks, and combine network mapping with generating fiber splicing sheets, calculating optical power in the network. And at the same time automate the output of all the design information that can be derived in one way or another from all the above data. It was implemented in C#. It looked awful, worked badly, freezed and crashed. It had some interest from vendors, but it was not successful, to put it mildly. It looked like this:
The decision to abandon all these developments and go back to automating graphics in MS Visio was made.
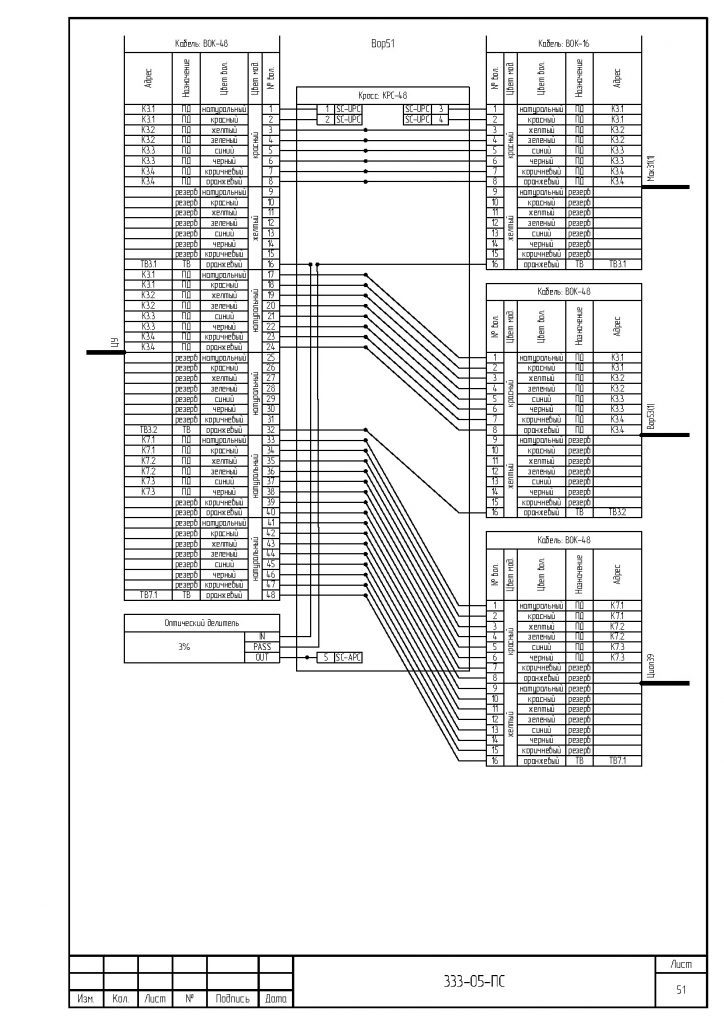
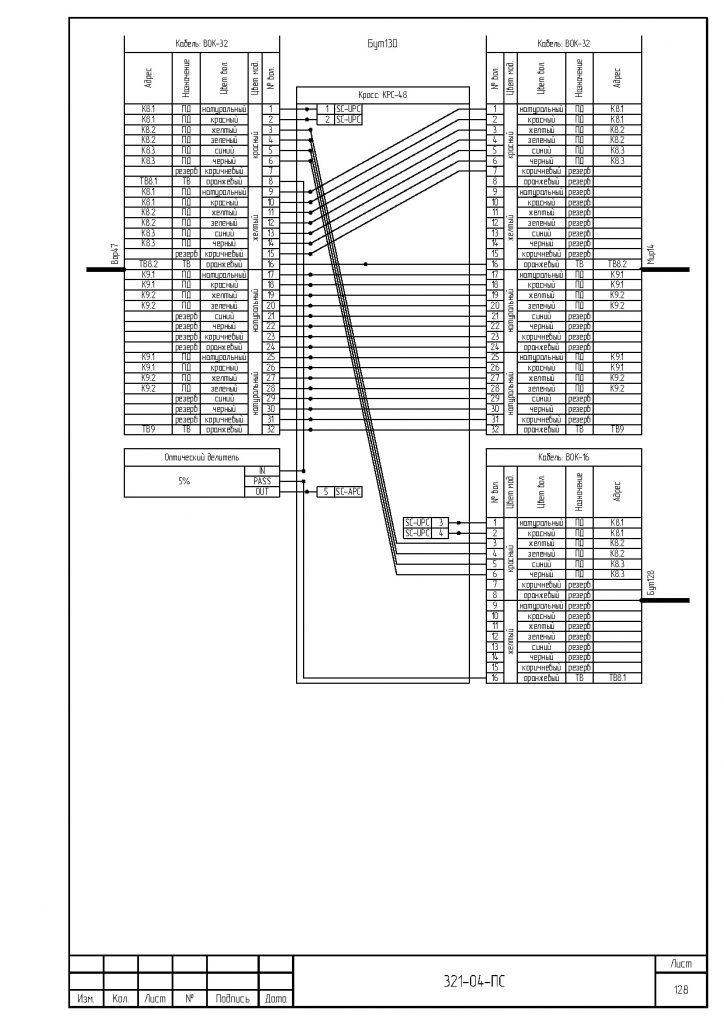
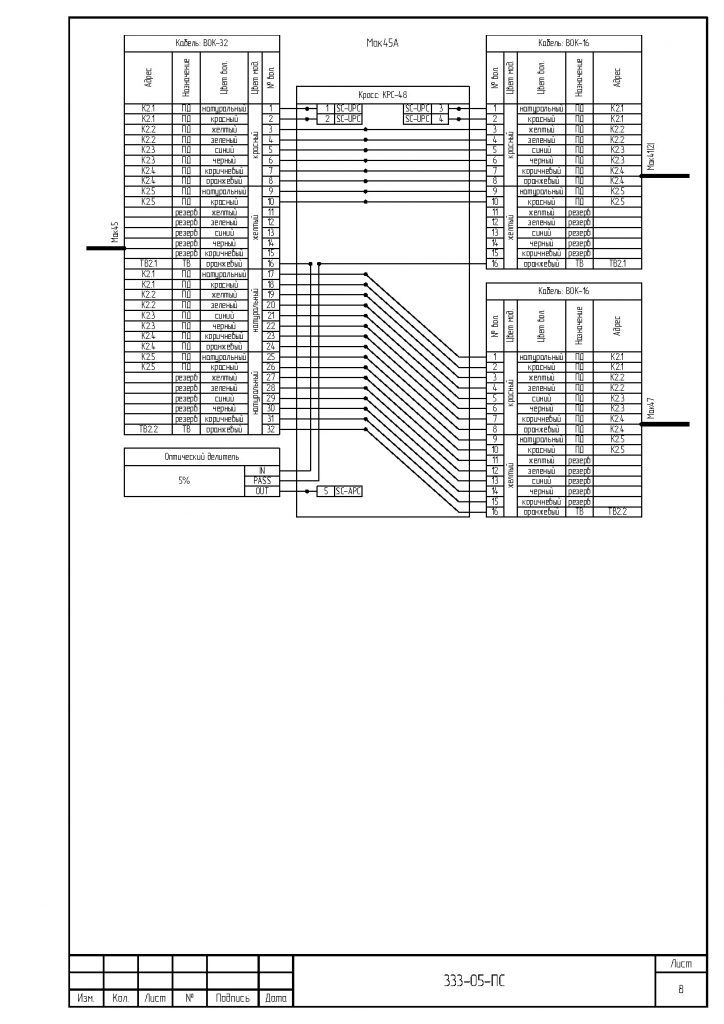
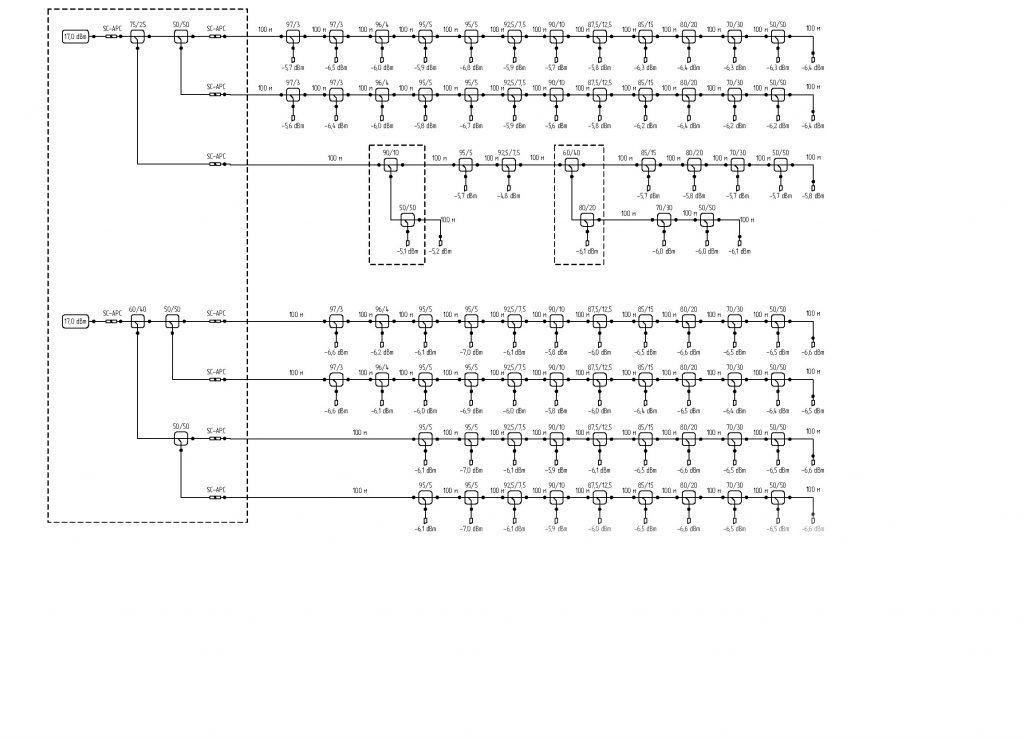
2011 saw another breakthrough. In a joint effort, the appearance of the fiber optic cables themselves and the page templates were completely redesigned. In this way, all fiber optic splicing drawings became uniform. Fiber optic cables and splitters were lined up in two columns. It was no longer possible to place cables or equipment on three sides of the sheet, or to place a splitter somewhere in the middle of the diagram. Strict rules were also introduced for connections: fibers could only bend at defined points. A high degree of uniformity and maximum readability were achieved. It also greatly increased the speed of diagram production. It eventually became the gold standard. Let me remind you that all this was done manually.
The method of calculating attenuation in the optical network has also changed, but that is not the subject of this discussion now.
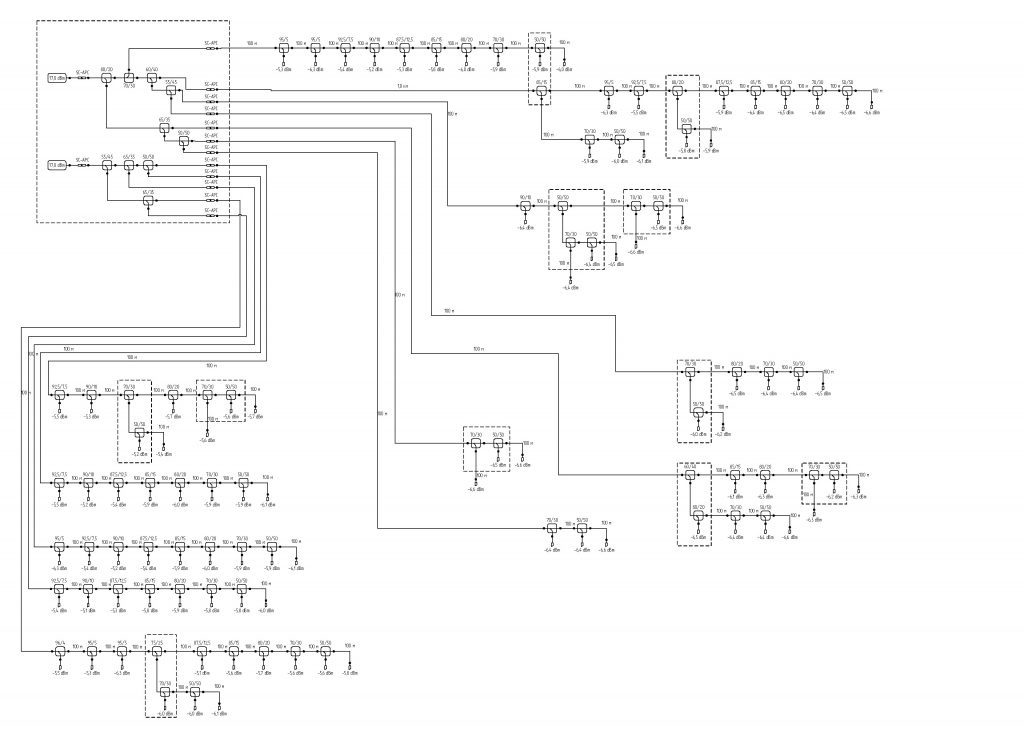
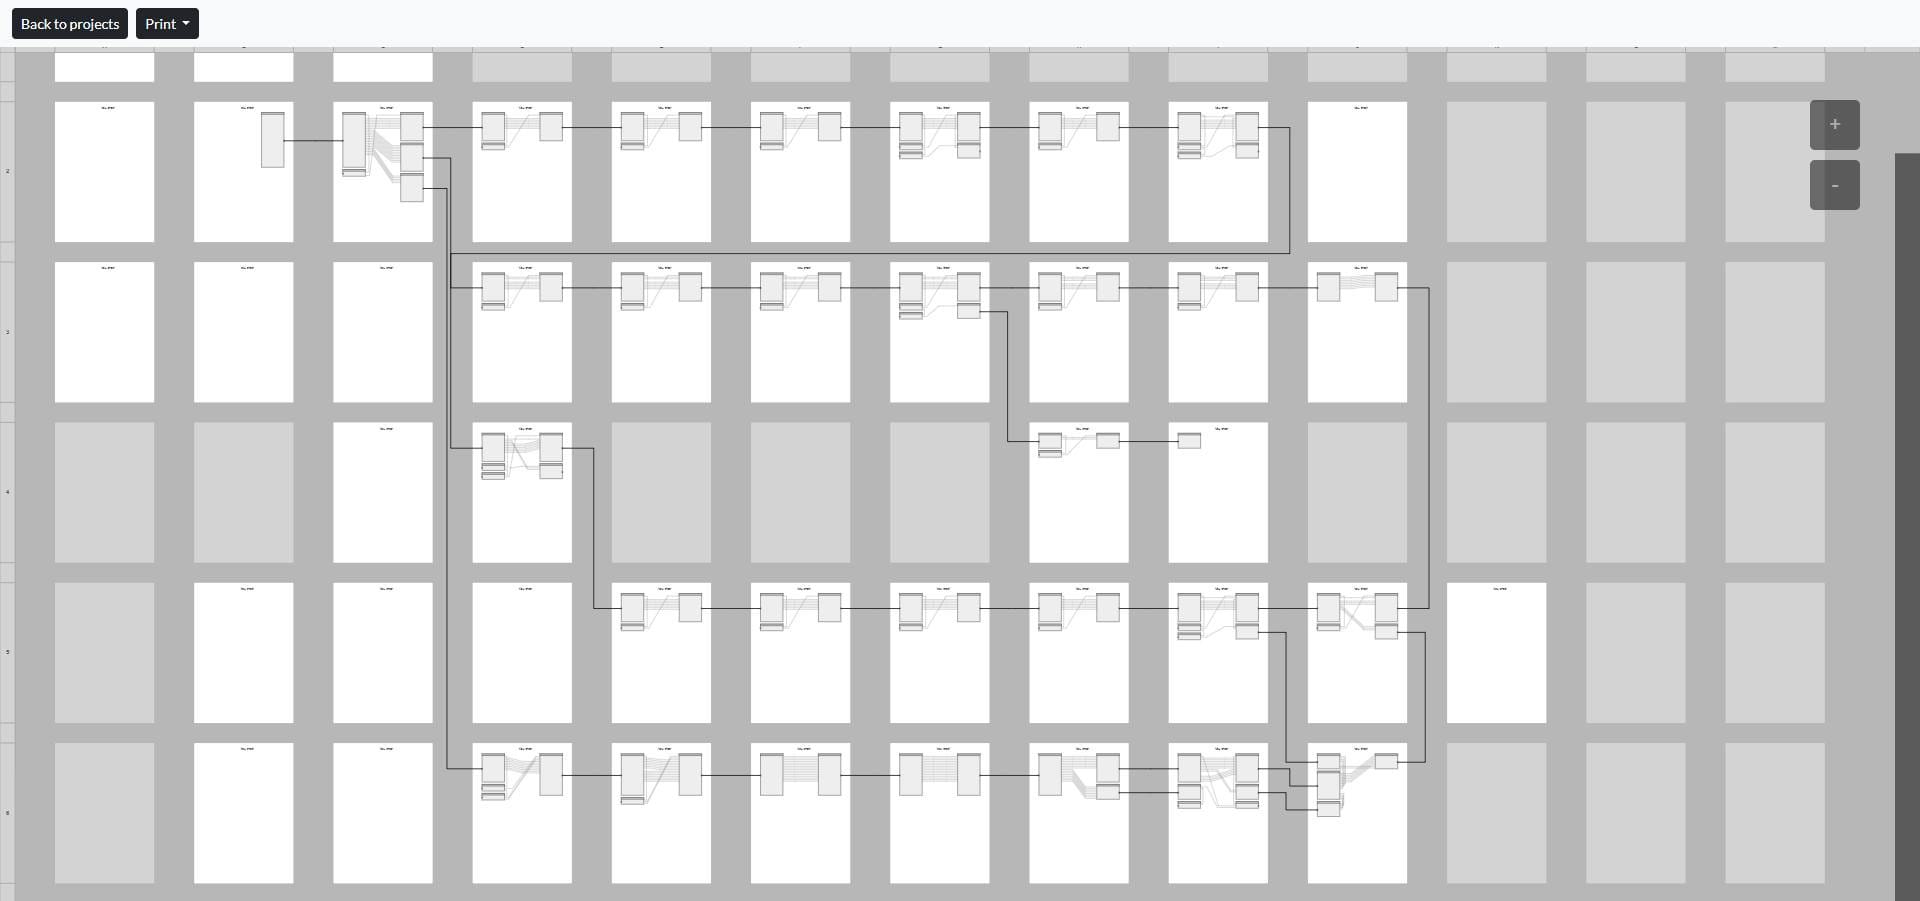
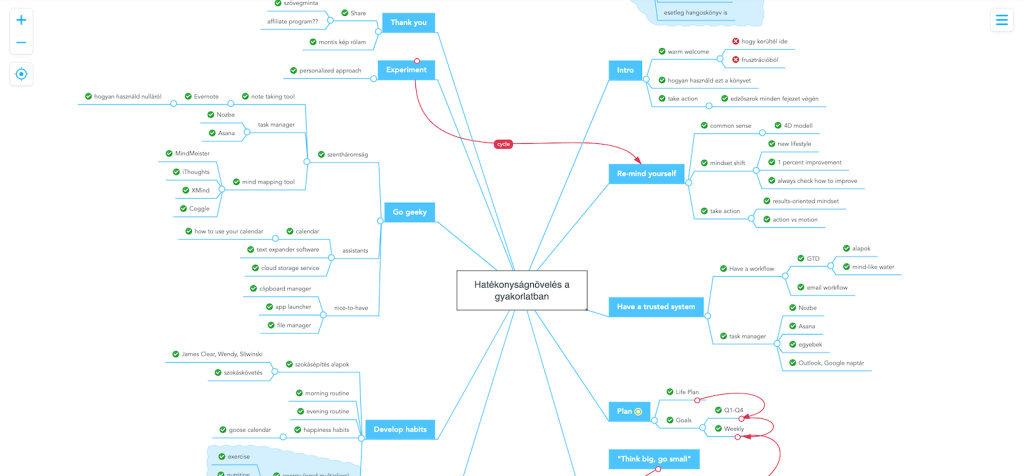
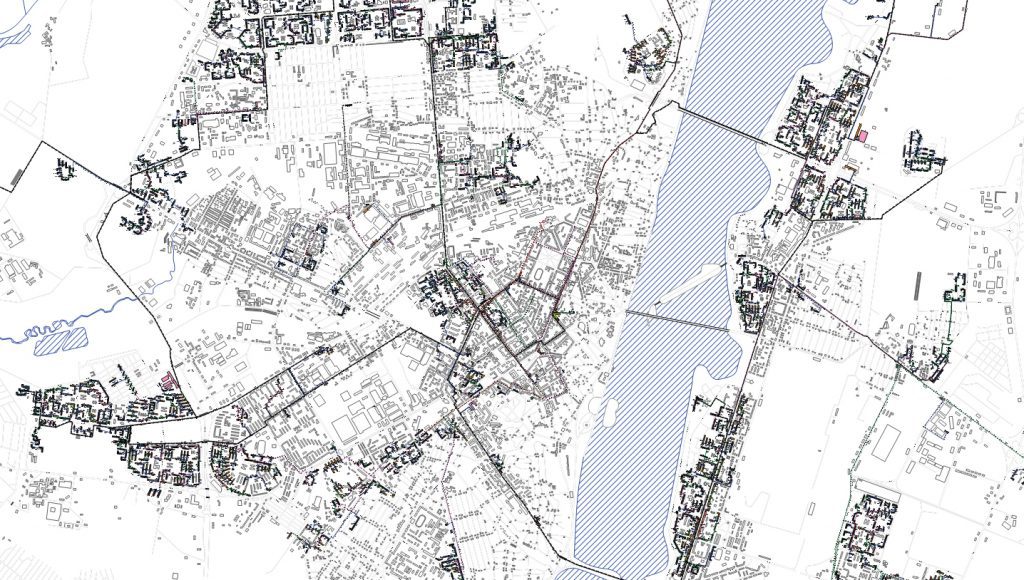
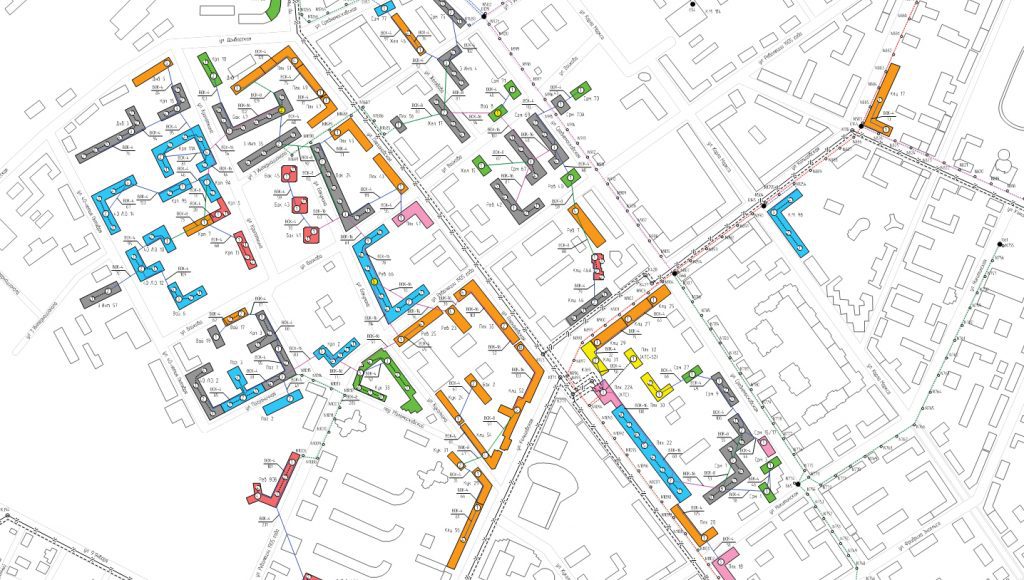
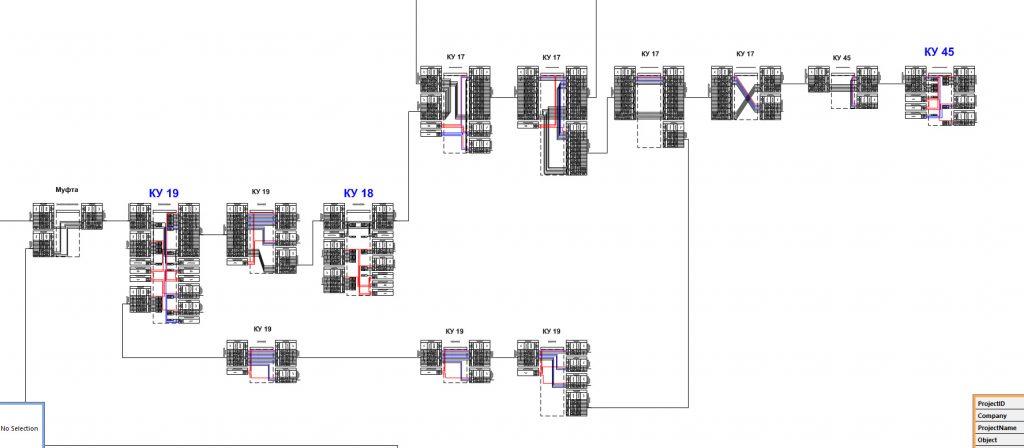
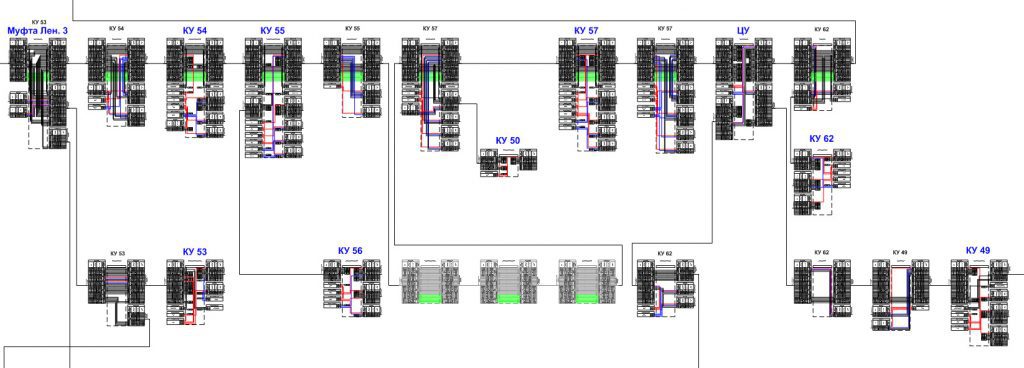
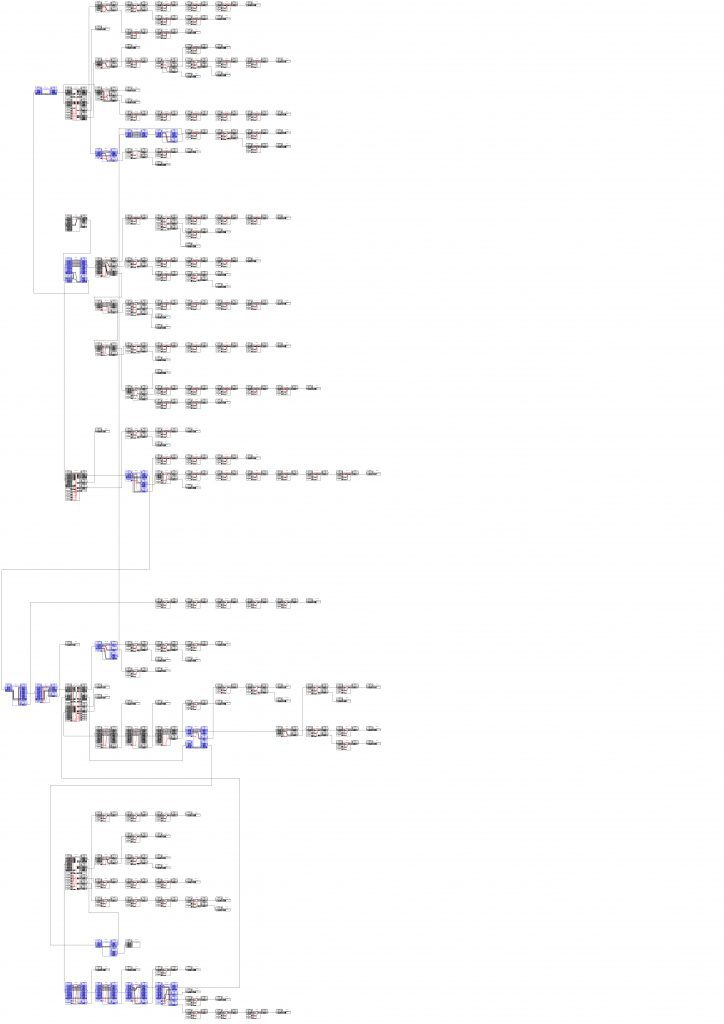
Based on the previous success, in 2012 we made perhaps the biggest leap. Still using MS Visio, we automated the mapping work to such an extent that we were able to produce all the necessary fiber optic splicing sheets without the involvement of an engineer, and in a perfect form. Since then, splicing was going hand in hand with mapping. To give you an idea, fiber optic network maps have also been brought to perfection, none of the competitors could boast such a quality of documentation. These are fragments of the same network map with different zooms
Since then, the approach to making fiber splice sheets in two modes has finally been formed – in the form of a «bedsheet» showing all the nodes of the network, and in the form of a separate page for each node of the optical network. Many convenient functions such as tracing and highlighting of fibers, numbering of sockets, etc. have been implemented. The functionality of selecting nominal values of optical splitters was implemented in an unusual way. It worked like this: splice sheets were generated from the network map, logical diagrams for calculating the optical power of the network and the signal attenuation were generated from the splicing sheets. Using the method of least squares, our software picked the nominal values of the optical splitters. And then the obtained values were put back into the fiber splicing sheets. I once made a video on this subject for a customer. The video is tedious and boring, but it gives you an idea of how it all worked.
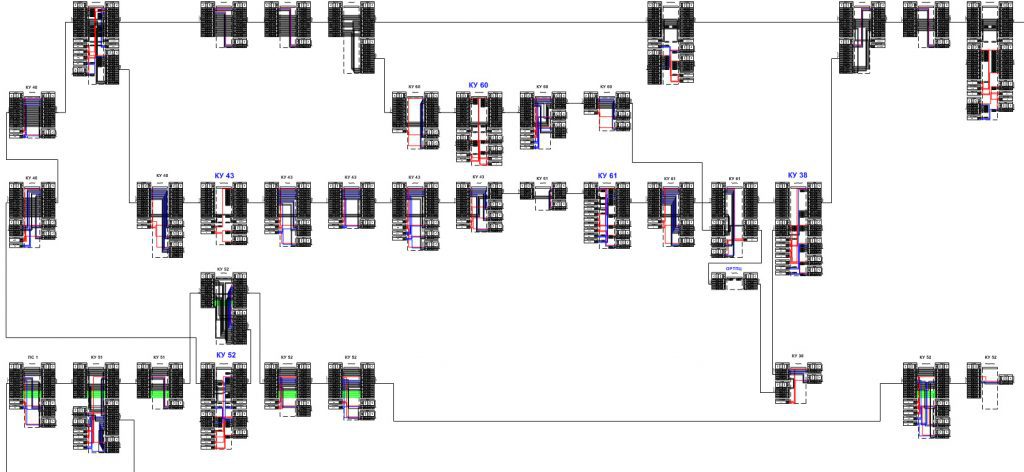
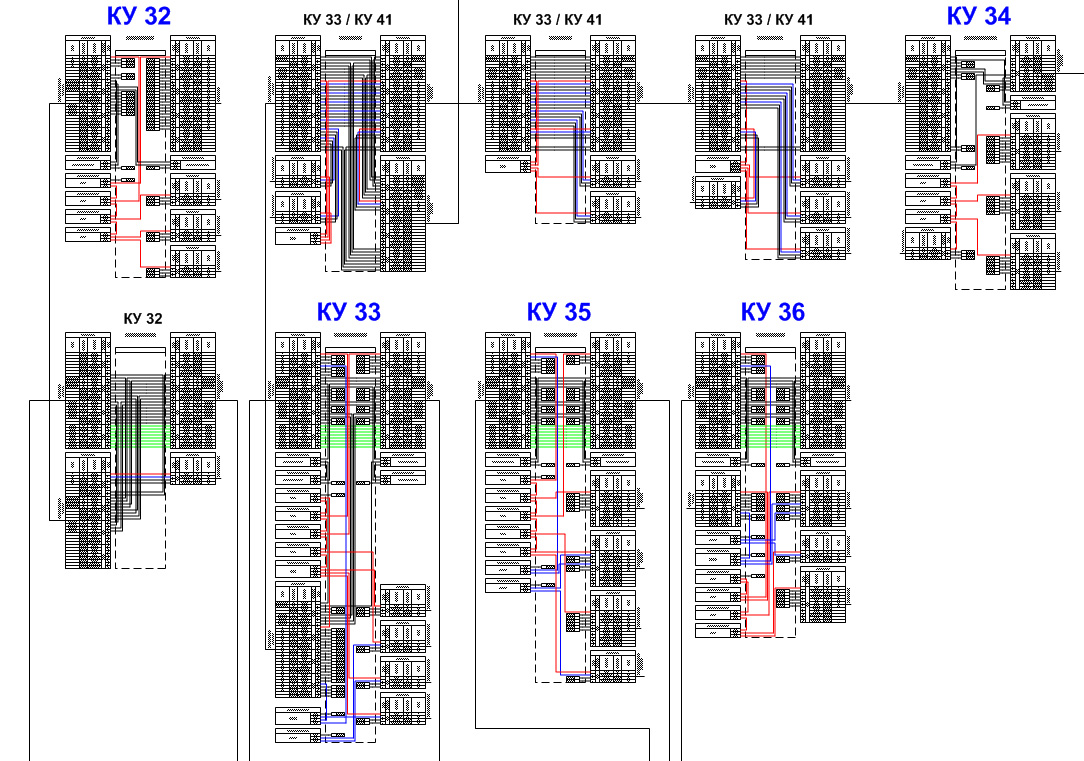
We had reached the pinnacle of this art. In 2013-2014 there were minor changes, small new features introduced, but nothing fundamentally new has been added. Have a look at our oeuvre.
End of PART 1.