Table of contents
Idea of a network diagram
What to show on a network diagram?
Relation between fiber network and fiber splice diagram
Perks of fiber optic network diagrams
Strange and funny aspects of network diagrams
Quirky trivia
Conclusion
Idea of a network diagram
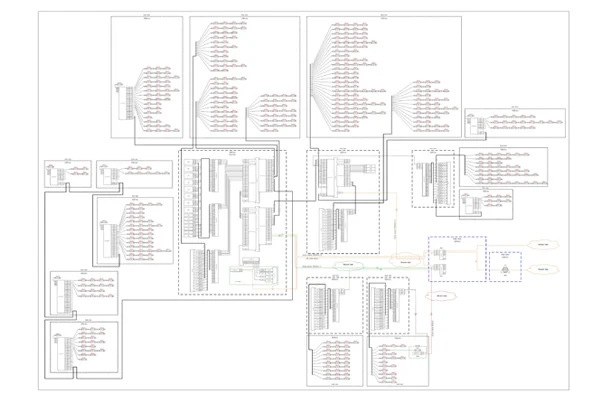
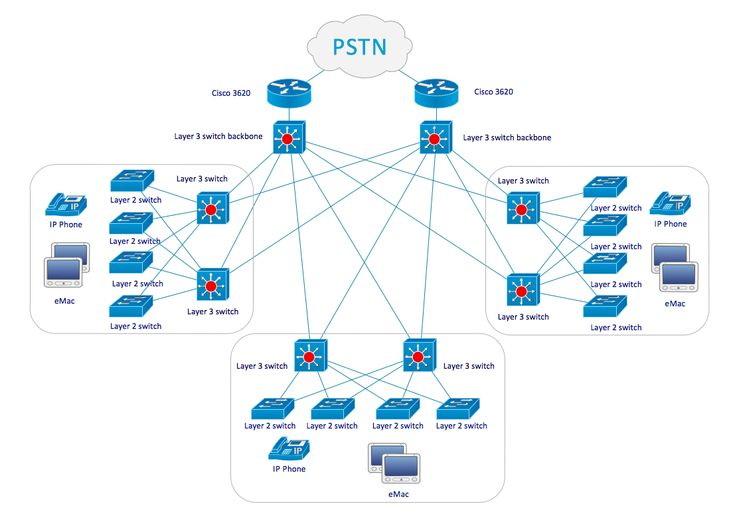
Fiber optic network diagrams represent the architecture and connectivity of fiber optic systems, and their design philosophy integrates technical, functional, and conceptual aspects. The diagrams abstract complex details of fiber optic systems to make them understandable for diverse stakeholders. The philosophy here is to balance complexity and simplicity based on the audience. The idea is to show:
- main nodes with main network equipment
- main paths and routes
- main technology, geography and topology
- hierarchy of all above mentioned
What to show on a network diagram?
But in such simplicity and order, that a 1 sec peek will give clear understanding of the network functionality to everyone: those who design, who invest, who build and who maintain. There’s no certain rule of how a fiber optic network diagram should look like, and since it’s impossible to depict everything on one drawing, it’s ok to break it into logical parts. For instance, it can be broken into separate diagrams showing:
- Backbone of the network
- Aggregation level
- Access level
or
- Core level
- Main fiber network clusters
- Typical fiber drop specs
or
- Fiber backbone and main cabinets
- Radio links between main and secondary nodes
- Inside plant access clusters
or whatever.
The ultimate goal of fiber optic network diagrams is to achieve an optimal combination of functionality, usability, and foresight. They’re not just technical blueprints but also strategic tools that embody the operational philosophy of a robust, efficient, and future-proof communication network.
See also:
4 key components of ftth network design – OSP fiber design explained
FTTH Planning and Design 101: Tools, Software, and What’s Next
Fiber network diagram and its relation with fiber splicing diagram
That’s awesome but that’s not the end. Even if you are utilizing the “straight line” approach, you will need to dive deeper into each line, as it will consist of many separate fibers. How do you transfer the fiber optic network diagram and design from your head to paper? Assuming you don’t have a pencil. Or you have one, but you still need to get the fiber design into the computer.
Here’s one way of doing fiber network diagrams when one needs to test various topology in a given scenario, e.g. 5 nodes, 1 central unit, 4 access points.

Linear or daisy chain topology fiber network diagram

Linear or daisy chain topology fiber splice diagram

Flat ring topology fiber network diagram

Flat ring topology fiber splice diagram

Star topology fiber network diagram

Star topology fiber splice diagram
And what if you need to make a mixed topology? Like two intersecting flat rings, where nodes 1 & 3 make a ring, and nodes 2 & 4 make another ring.
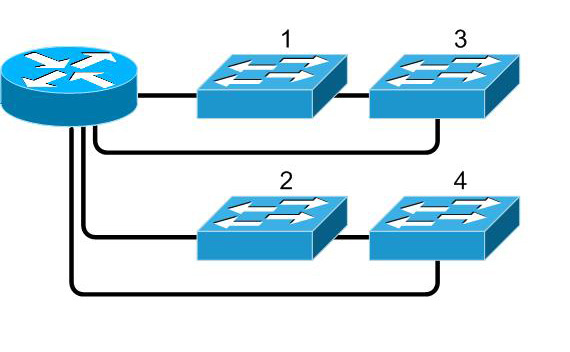
Mixed topology fiber network diagram

Mixed topology fiber splice diagram
Perks of fiber optic network diagrams
- They’re scalable maps of the internet’s backbone. Optic network diagrams often reveal the “veins” of global communication. A well-drawn diagram can make you feel like you’re looking at the nervous system of the digital world – quite awe-inspiring!
- They save time and money. By visualizing potential bottlenecks, redundancies, and expansion opportunities, these diagrams help engineers preemptively address challenges. A $10 design tweak on a diagram can prevent a $1M network failure in the real world.
- They’re universally understood by network nerds. The symbols and conventions used in these diagrams are universal in the industry. If you can interpret a fiber optic diagram, you can work almost anywhere in the telecom world, no matter the language or country.
- Easier collaboration. Fiber optic diagrams make it simple for interdisciplinary teams – civil engineers, IT experts, and telecom specialists – to align on goals. They act like a Rosetta Stone for infrastructure.
Strange and funny aspects of network diagrams
- Spaghetti syndromes. Early or poorly planned diagrams sometimes resemble a bowl of spaghetti – fibers crossing haphazardly with no rhyme or reason. These chaotic messes are usually the bane of engineers’ existence and the punchline of many industry jokes.
- Hidden treasures. Sometimes, while updating diagrams, engineers discover “forgotten” cables: unused or undocumented fibers laid down years ago. These so-called dark fibers are like buried treasure, saving companies millions by repurposing them.
- Creative topologies. Diagrams sometimes resemble actual objects or shapes unintentionally, such as spiders (for star topology) or honeycombs (in dense urban setups). Engineers might jokingly nickname designs based on these appearances.
Quirky trivia
- Fiber diagrams are like family trees. Engineers sometimes joke that fiber optic diagrams resemble family genealogies: they both involve lots of branching and occasionally feature unknown ancestors (forgotten nodes).
- DIY “fiber optic art”. Some engineers turn their diagrams into artwork – using colorful fiber paths to make geometric designs. While not strictly functional, these add a bit of flair to the technical world.
Conclusion
Fiber optic network diagrams might look dry at first glance, but they’re filled with creative problem-solving, a touch of humor, and occasionally, surprising beauty. From acting as strategic tools to revealing the hidden web of global communication, they represent much more than just lines on a page – they’re the unsung heroes of our connected world.
Take care of your splice sheets
1000+ ISPs are already saving weeks of work with Splice.me!

