Doing some fiber optic mapping, FTTH planning, fiber cable network design is not that simple. And it all starts from and comes down to a map. But where to start from? Yeah, we aren’t discussing just picking some image and painting on it.
Easy way of fiber network mapping
You can use some GoogleMaps of course and draw some lines on it. Or Google Earth. But you have probably already tried it.
More advanced GIS software like QGIS or ArcGIS can be used, but it requires at least some skills. In return it gives a lot of functionality and automation when it comes to network or just fiber mapping.
Advanced way of fiber optic mapping
Since you are reading this post, it means you are also not ready to use specialized fiber network management software, which is nearly always GIS-based, and provides a vast range of fiber mapping and fiber planning capabilities. Least known software provides ugly fiber network planning, the behemoths of telecom industry are way too expensive. You’d like to use splice.me, but you still want to create some network map.
Manually getting a map
I’m sure you are good at some CAD. So let’s make a fiber map.
1. Download and install Maperitive from maperitive.net.
2. Run it.
3. Navigate to the desired location.
4. Click Map / Set geometry bounds and adjust your selection
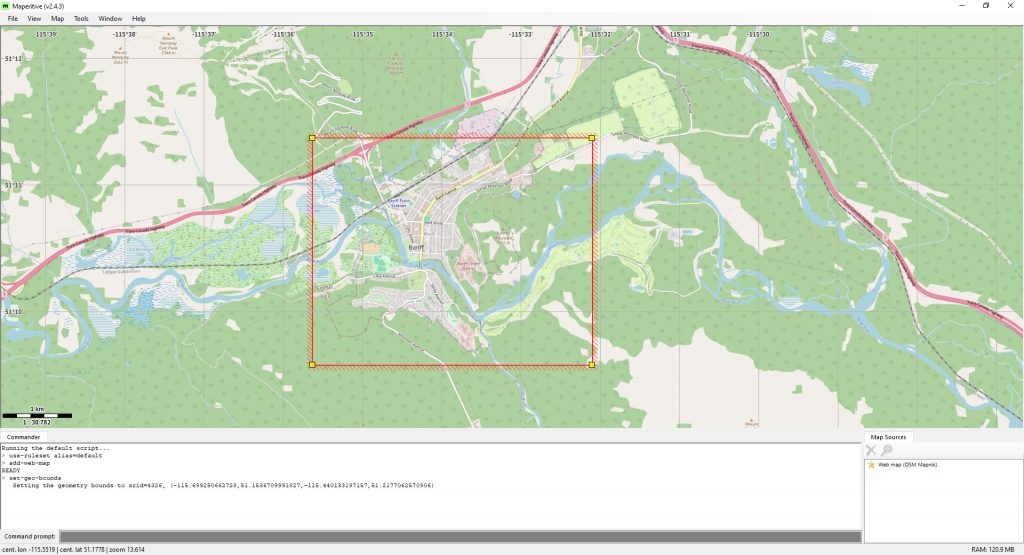
5. Click Map / Download OSM data (overpass API)
6. When the task is complete – in the tiny ‘Map source’ window on the bottom right select ‘Web map (OSM Mapnik)’ and click the red cross (Remove the map source), so only ‘OSM file (not saved)’ remains there.
7. Now copy this line: export-svg compatibility=illustrator zoom=17
And paste it into the command prompt on the bottom and hit Enter.
8. After the process is complete you will find your SVG map somewhere like %Maperitive%\output\output.svg
Preparing it to become a fiber map or network map
You can import your SVG into AutoCad (after some converting), or illustrator, draw.io, Visio, whatever. Let’s look at Visio as it offers tons of automation. Okay, run visio, open the svg.
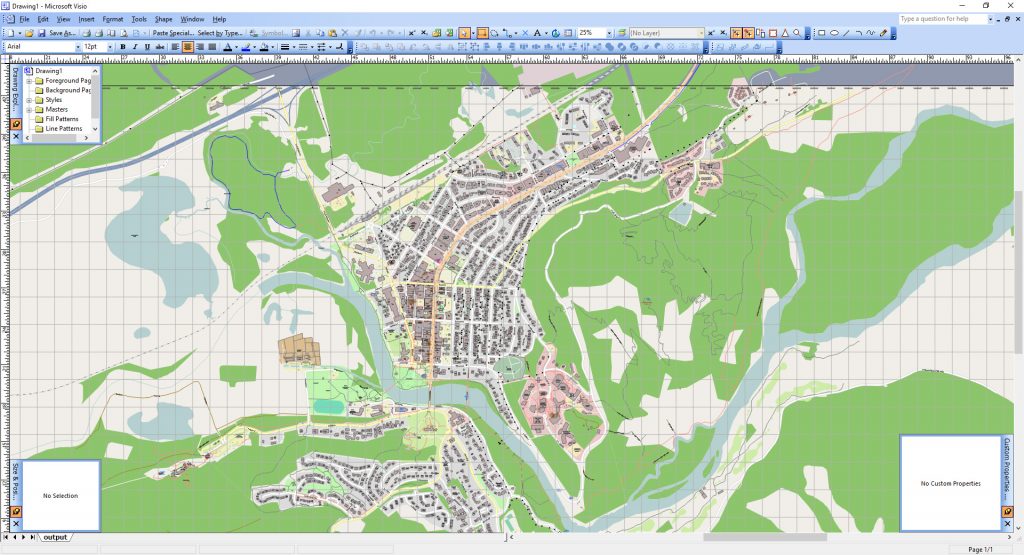
It has plenty of rubbish and unwanted objects. Since you don’t want to manually work on it and waste time, ungroup everything multiple times and use this VBA code. It cycles through all objects and kills everything unwanted, leaving roads, buildings, names and stuff.
Don’t know how to run VBA scripts in Visio? Hit Alt+F11, paste the following code, hit F5 to run it.
					Sub Cleaner1()
Dim UndoScopeID1 As Long
UndoScopeID1 = Visio.Application.BeginUndoScope("Cleaner1")

Dim x As Double
Dim z1 As String
Dim z2 As String
Dim z3 As String
Dim z4 As String
Dim z5 As String
Dim z6 As String
Dim z7 As String
Dim z8 As String

Dim shp As Visio.Shape
Dim sel As Visio.Selection
Dim vsoCell As Visio.Cell

ActiveWindow.SelectAll
Set sel = ActiveWindow.Selection

For Each shp In sel

    z1 = shp.Cells("FillForegnd").FormulaU
    z2 = shp.Cells("FillPattern").FormulaU
    z3 = shp.Cells("LinePattern").FormulaU
    z4 = shp.Cells("LineColorTrans").FormulaU
    z5 = shp.Cells("LineColor").FormulaU
    z6 = shp.Cells("ImgWidth").FormulaU
    'z7 = shp.Cells("Char.ColorTrans").FormulaU
    z8 = shp.Cells("Char.Size").FormulaU
    z9 = shp.Cells("Char.Color").FormulaU

    Select Case z1
        'unneded by color
        Case "RGB(223,222,222)", "RGB(242,238,232)", "RGB(235,219,231)", "RGB(255,255,229)", "RGB(242,217,216)", "RGB(199,199,179)", "RGB(222,221,206)", "RGB(199,199,179)", "RGB(243,227,221)", "RGB(221,221,231)", "RGB(255,214,208)", "RGB(244,220,185)", "RGB(232,230,226)", "RGB(181,180,146)", "RGB(220,220,220)", "RGB(249,128,114)", "RGB(108,112,212)", "RGB(200,176,132)"
            shp.Delete
        'icons and pictograms
        Case "RGB(0,146,217)", "RGB(114,74,8)", "RGB(191,0,0)", "RGB(76,76,0)", "RGB(171,56,171)", "RGB(68,76,3)", "RGB(67,67,67)", "RGB(11,132,22)", "RGB(98,93,93)", "RGB(105,100,69)", "RGB(95,53,86)", "RGB(76,76,76)", "RGB(68,68,68)", "RGB(153,51,153)", "RGB(171,69,171)", "RGB(76,127,178)", "RGB(119,119,119)", "RGB(49,59,0)", "RGB(237,238,214)", "RGB(185,169,156)"
            shp.Delete
        'greenery
        Case "RGB(205,235,176)", "RGB(200,250,204)", "RGB(222,251,226)", "RGB(172,208,157)", "RGB(170,223,202)", "RGB(200,224,191)", "RGB(237,239,213)", "RGB(214,216,158)", "RGB(170,202,175)", "RGB(192,246,176)", "RGB(141,197,108)", "RGB(207,236,168)", "RGB(137,210,174)", "RGB(169,202,174)", "RGB(51,204,153)", "RGB(116,220,186)"
            shp.Cells("FillPattern").FormulaU = "0"
            shp.Cells("LinePattern").FormulaU = "1"
            shp.Cells("LineColor").FormulaU = "RGB(51,153,102)"
            shp.Cells("LineWeight").FormulaU = "0.24pt"
        'buildings
        Case "RGB(216,207,200)", "RGB(195,181,171)", "RGB(207,207,207)", "RGB(188,169,169)"
            shp.Cells("FillForegnd").FormulaU = "RGB(234,234,234)"
            shp.Cells("LinePattern").FormulaU = "1"
            shp.Cells("LineColor").FormulaU = "RGB(51,51,51)"
            shp.Cells("LineWeight").FormulaU = "0.24pt"
        'parking lots
        Case "RGB(237,237,237)", "RGB(226,202,222)", "RGB(239,200,200)", "RGB(223,209,214)", "RGB(240,240,216)", "RGB(246,238,183)", "RGB(204,254,240)", "RGB(254,152,152)"
            shp.Cells("FillPattern").FormulaU = "0"
            shp.Cells("LinePattern").FormulaU = "1"
            shp.Cells("LineColor").FormulaU = "19"
            shp.Cells("LineWeight").FormulaU = "0.24pt"

    End Select

    'with fill patterns
    If z2 <> "0" And z2 <> "1" Then
        shp.Delete
    End If

    'with line patterns
    Select Case z3
        Case "23", "9", "10", "3", "11"
            shp.Delete
    End Select

    'with line opacity
    Select Case z4
        Case "60%", "40%", "70%", "76%"
            shp.Delete
    End Select

    'lines with color
    Select Case z5
        Case "RGB(68,68,68)", "RGB(127,127,127)", "RGB(246,132,116)" 'some lines
            shp.Cells("FillPattern").FormulaU = "0"
            shp.Cells("LinePattern").FormulaU = "1"
            shp.Cells("LineColor").FormulaU = "RGB(150,150,150)"
            shp.Cells("LineWeight").FormulaU = "0.24pt"

        Case "RGB(186,186,186)", "RGB(142,142,142)", "RGB(112,125,4)", "RGB(202,163,111)", "RGB(188,129,130)", "RGB(191,191,191)", "RGB(203,203,142)", "RGB(141,141,141)" 'roads turn black underneath
            shp.Cells("LineColor").FormulaU = "0"
            shp.Cells("LineCap").FormulaU = "0" 'round caps

        Case "RGB(253,214,164)", "RGB(254,254,178)", "RGB(236,162,163)", "RGB(237,237,237)" 'roads atop turn white
            shp.Cells("LineColor").FormulaU = "1"
            shp.Cells("LineCap").FormulaU = "0" 'round caps

        Case "RGB(176,176,176)" 'grid
            shp.Delete

        Case "20" 'unneeded building outlines
            shp.Delete
    End Select


    'check if its a pick
    Select Case z6
        Case "Width*1"
            shp.Delete
    End Select

    'text check
    Select Case z8
        Case "6 pt"
            shp.Cells("Char.Size").FormulaU = "8 pt" 'building numbers font size
            shp.Cells("Char.Font").FormulaU = "64" 'font
            shp.Cells("Char.Style").FormulaU = "0" 'remove bold
            shp.Cells("Char.FontScale").FormulaU = "100%" 'font scale
            shp.Cells("Char.Color").FormulaU = "19" 'font color

        Case "6.75 pt"
            shp.Cells("Char.Size").FormulaU = "9 pt" 'street name font size
            shp.Cells("Char.Font").FormulaU = "64" 'font
            shp.Cells("Char.Style").FormulaU = "0" 'remove bold
            shp.Cells("Char.FontScale").FormulaU = "100%" 'font scale
            shp.Cells("Char.Color").FormulaU = "19" 'font color
    End Select

    'text coordinates
     Select Case z9
        Case "RGB(48,48,48)", "1"
            shp.Delete
    End Select

Next shp
ActiveWindow.DeselectAll

Application.EndUndoScope UndoScopeID1, True
End Sub
Use this code to wipe glyphs from the map.
					Sub PatternKiller()
Dim UndoScopeID1 As Long
UndoScopeID1 = Visio.Application.BeginUndoScope("PatternKiller")

Dim vsoMasters As Visio.Masters
Dim intMasterCount As Integer
Dim vsoCurrentDocument As Visio.Document
Dim vsoApplication As Visio.Application
Dim i As Integer

    Set vsoApplication = GetObject(, "visio.application")
    Set vsoCurrentDocument = vsoApplication.ActiveDocument
    Set vsoMasters = vsoCurrentDocument.Masters
    intMasterCount = vsoMasters.Count
    'MsgBox (intMasterCount)

    'For i = 1 To intMasterCount
    '    MsgBox (vsoMasters.Item(i).Name)
    'Next i

    i = 0
    For i = 0 To intMasterCount
        On Error Resume Next
        vsoMasters.Item(i).Delete
    Next i

Application.EndUndoScope UndoScopeID1, True
End Sub
When you’re through with that, don’t forget to add “Map data © OpenStreetMap contributors” text to your map.
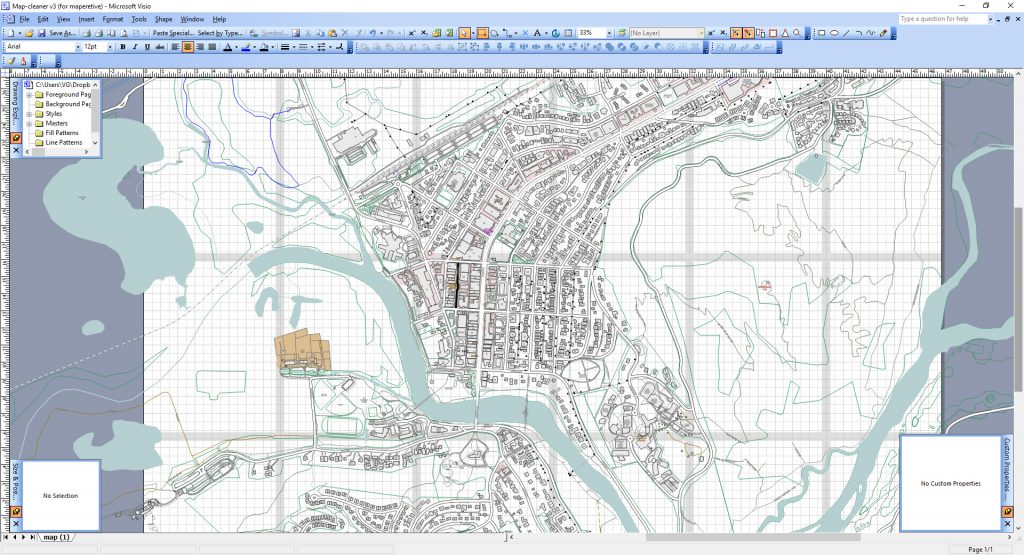
Now you are ready for drawing cables, fiber mapping, ftth planning, whatever. Don’t forget to return and create beautiful fiber splice diagrams in splice.me
Continue digging on this topic:
Don't hesitate! Start using splice.me
Create, manage, control all your fiber splicing in one place, fast and easy

