«Fiber network design» is not about drawing some basic diagram, either by hand or using some flashy ai service. It’s a thing consisting of many parts you should know how to make. It combines technical planning, physical infrastructure design, optical performance calculations, and the necessity to comply with tons of standards and regulations in completely different fields.
For a «network design» to be considered «network project», it has to integrate network maps, cabling layouts, structured cabling, vaults and trenches drafts, pole attachments drafts, floor plans, rack diagrams, PON calculations, BOQs, etc. into a single coordinated documentation set.
Only this approach in fiber infrastructure planning can ensure compliance with technical and regulatory requirements and guarantee the legality of the service provider’s business.
Network topology design and Network architecture
If you are a sysadmin network administrator, throw some icons on a sheet, connect with lines and write ip addresses. That’s enough, but we’re not discussing that.
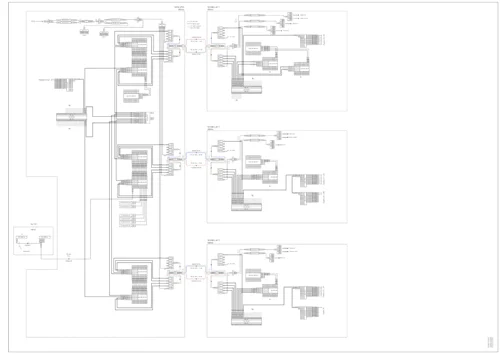
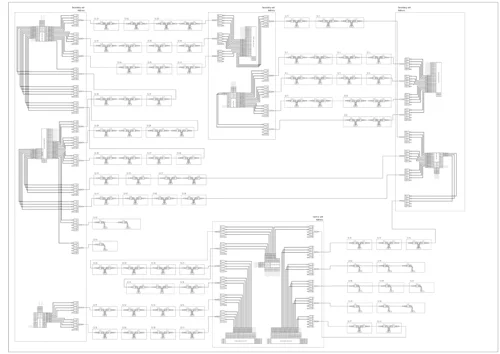
A network topology and architecture design is the cornerstone of every network, no matter how big or small it is. First of all, don’t approach it and don’t think about it the same way as the network map. It should not in any way resemble the network mapping and should be abstract in terms of network’s geography. The main goal is to show the network hierarchy. So start from putting something depicting the main and most important node of your network in the center of the page, most often – the network’s central office. Then proceed with some backbone nodes, or aggregation level nodes, stepping aside from the central unit. And continue down to the access level nodes. Often the resulting topology and hierarchy diagram would look like a pyramid.
Don’t hesitate to make certain things distinguishable. Make backbone connection lines thicker or use a different color. Group similar nodes in clusters. Avoid excessive line crossings. The same network diagram can be drawn in many ways, but the best scenario – is the most readable and understandable drawing at first glance.
What to show on the network topology design diagram? When the coarse layout is done, fill it with all active network equipment. Should it be just boxes with names? No. Every piece of network equipment should have interfaces and the port’s names. Then draw all the physical connections and designate them. Use different colors for different cable types, or different interfaces. Each connection should bare the cable type and it’s length. If it turns out to be all tangled – spend time untangling it. The best diagram has no connection line crossings.
Network cable layout and design
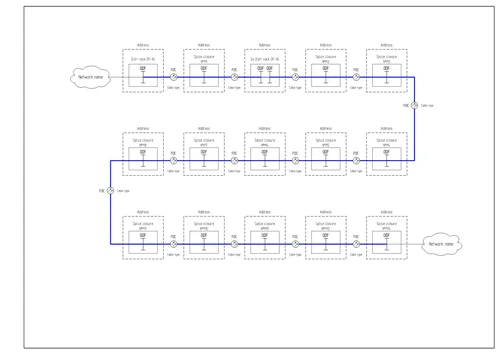
A google map as a background can only be used for a sketch/draft of a network cable layout diagram. Use it when you are exploring the possible and feasible cable routes. Google map in a complete fiber network project is unacceptable. A complete guide of creating a vector background map for your network cable layout diagrams is thoroughly described in this article.
The main question is not what to show (obviously your cable routes), but how to show. Bon ton is to make all the background vector map a little bit lighter or slightly transparent, so the cable routes aren’t lost among the map details. Use thicker and colored lines for cable paths. Use different colors for cables of different hierarchy, or type, or fiber count.


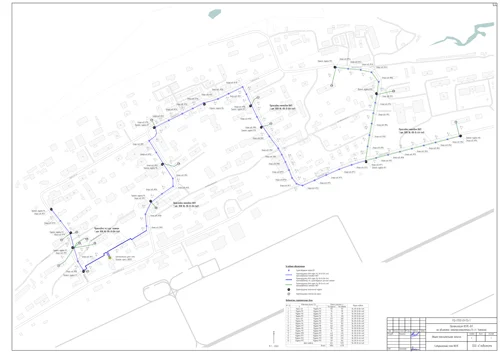
There’s no sense in downloading VSD maps
Cable trenches and handholes
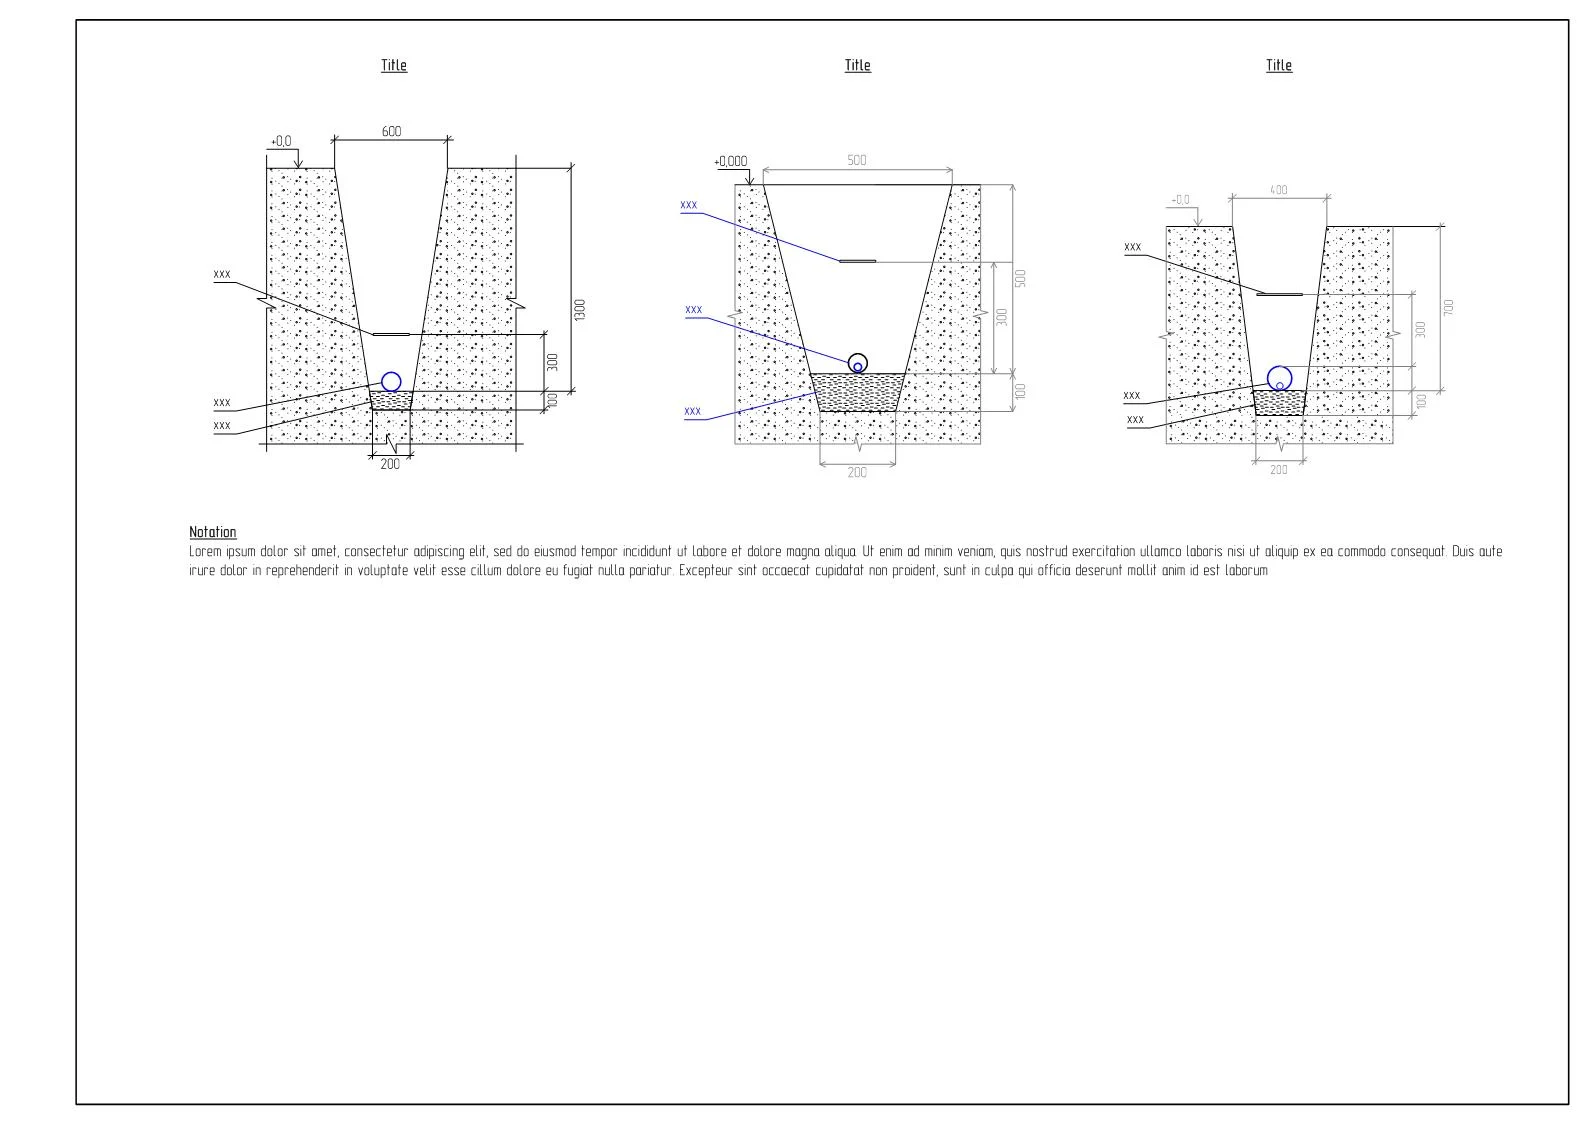
Proper manhole, handhole and cable vault design ensures safe access to fiber infrastructure while protecting cables and splice closures from environmental damage. But every location is different. In terms of design – the drawing should give an exact location for both builders and those who will maintain it. It means a place on a map and distances to closest stationary objects. And sometimes a signal marker post. But every location is different. So bon ton is to add some text on this drawing, explaining why you placed a handhole exactly here – e.g. convenience of access, less disruption, smaller probability of damage, etc.
A trench drawing should have all the dimensions. I mean all of them! Not just the width at the top. But also depth on both sides, and width at the bottom. A cable trench diagram must show how thick the sand basement should be added, where the fiber cable should be placed. If it needs extra protection – specify how high above the cable a layer of bricks should be placed. And at what depth a signal ribbon should be placed. The same applies to direct buried fiber splice closures. A radio marker for a direct buried


The poles
Utility pole and electrical tower diagrams
When you are attaching fiber, closures, and other equipment to utility poles, one should know at least the height of attachements.


Pole attachments for aerial network design
Draw all pole clamps used and itemize all of it’s components, preferably with part numbers. Bon ton is to list the weight of each item and the total weight of the assembly. The same applies to splice closures being attached on poles and towers.


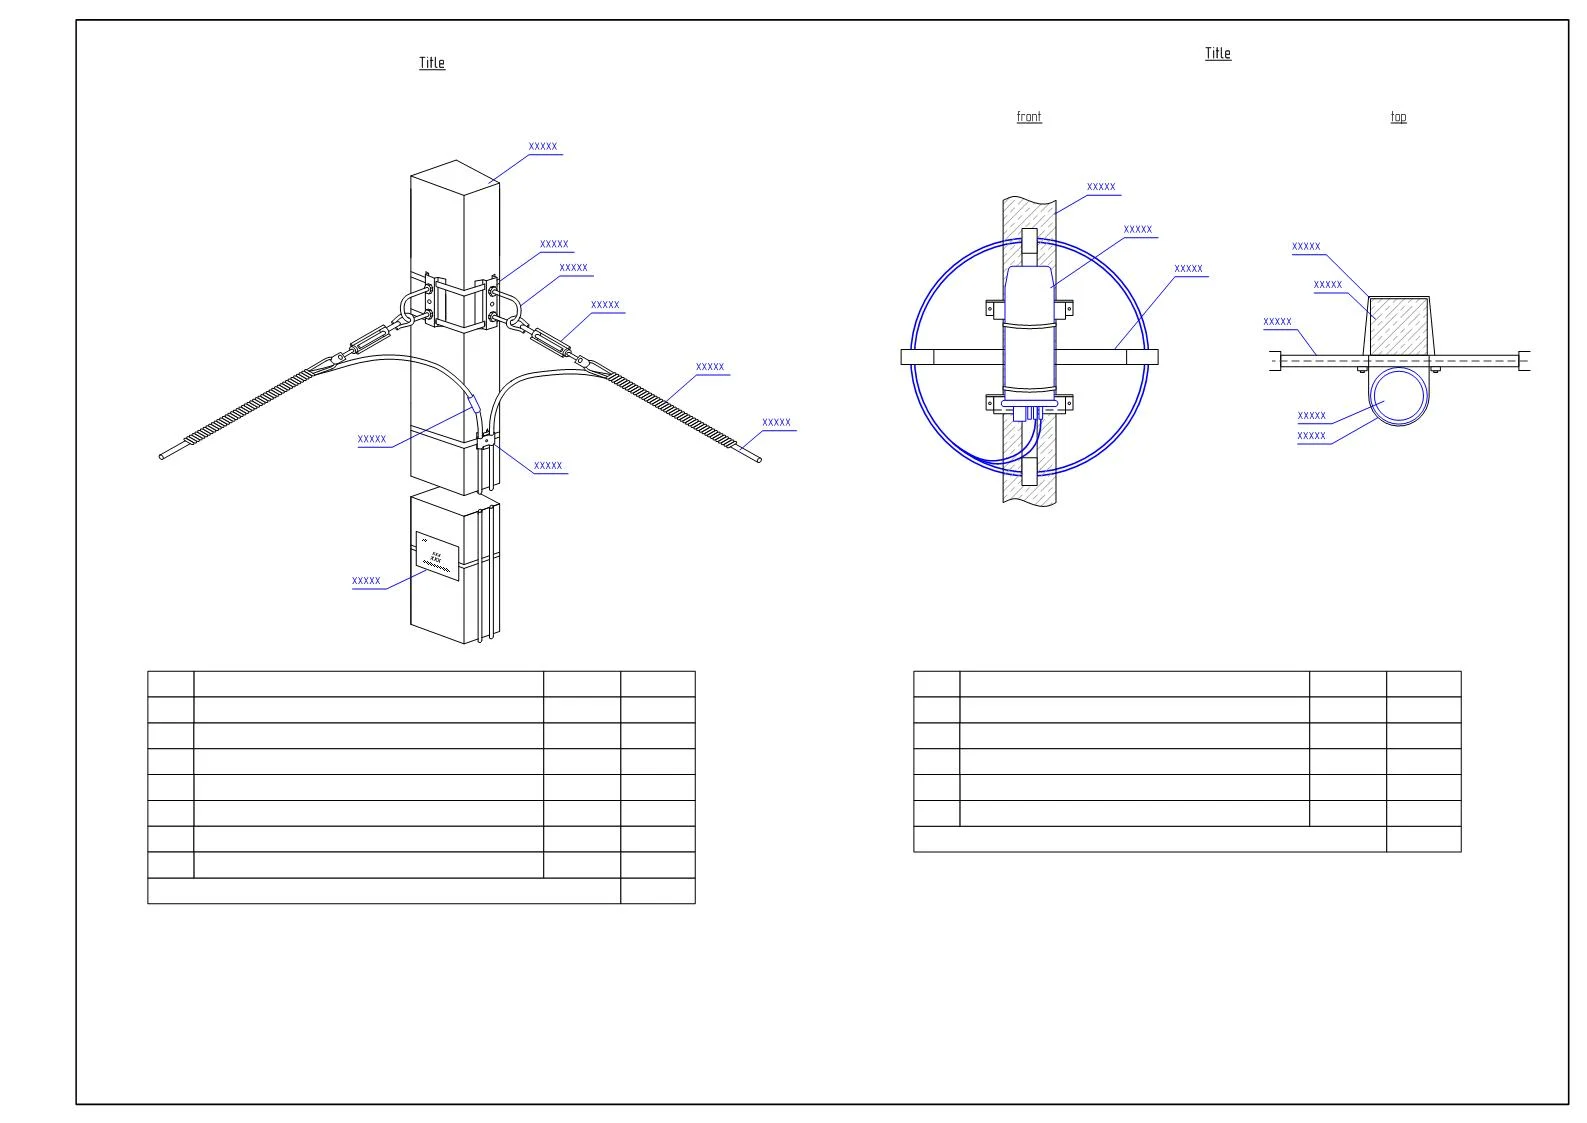


Cable transitions from buried to aerial
Except all heights and dimension, define how the horizontal cable run should be protected. Should it be a plastic or metal riser or some other type of housing, how it is sealed on both ends.


Towers and radio links design
Everything from utility pole section applies here. In addition to heights of attachment, the riser path should be clearly depicted. Simply to calculate the link budget – there’s lots of online calculator. To build the radio link profile diagram – use a tool from Cambium Networks.


LAN (local area network) design and structured cabling
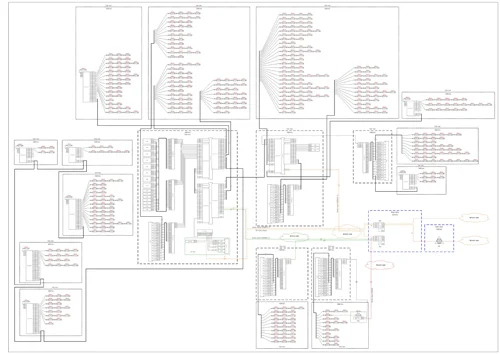
One can make LAN diagrams and structured cabling diagrams in many possible ways. LAN network design and structured cabling form the backbone of reliable data communication within buildings, campuses, and industrial facilities. Structured cabling design follows standardized architectures that separate the network into functional subsystems, such as entrance facilities, equipment rooms, telecommunications rooms, and work areas. The goal is to show all critical components without overwhelming the reader. Do not combine too much logical data into physical cable layouts. Avoid abbreviations that are not industry standard. Every label should be meaningful without requiring external explanation.
A LAN and structured cabling design isn’t complete without supporting documentation – port assignment tables, cable schedules, connection lists. Also reserve spare patch panel capacity, and unused cable pathways. Diagrams should clearly indicate spare ports and expansion zones to avoid guesswork during upgrades and maintenance.


Floor plans and network cable routing
Floor plans are a bit tricky. A rectangle with dimensions is not enough. The base drawing should be an accurate architectural plan that includes walls, doors, windows, columns, shafts, ducts, risers, etc. Then you add and designate building axes, then all the dimensions.
Network cable design should be on a separate layer dedicated to telecommunications infrastructure, ensuring that cable routes are clearly distinguishable. Electrical, HVAC, plumbing, other systems (if any) should be turned off on the diagram.
Cable routing floor plans should show only information that directly supports network installation and maintenance. This includes server rooms, cabinets, racks, cable trays, conduits. Each outlet should be clearly labeled and referenced to the corresponding cable schedule and port assignment documentation. A common mistake in cable routing floor plans is overloading the drawing with unnecessary technical details. IP addresses, VLAN IDs, switch configurations, and logical network parameters do not belong on physical routing plans and should be documented separately. Excessive text, decorative elements, or overlapping cable paths reduce clarity and increase the risk of misinterpretation in the field. Designers should avoid drawing every individual cable when large bundles follow the same route. Instead, aggregated pathways should be shown with clear annotations indicating cable counts and types.
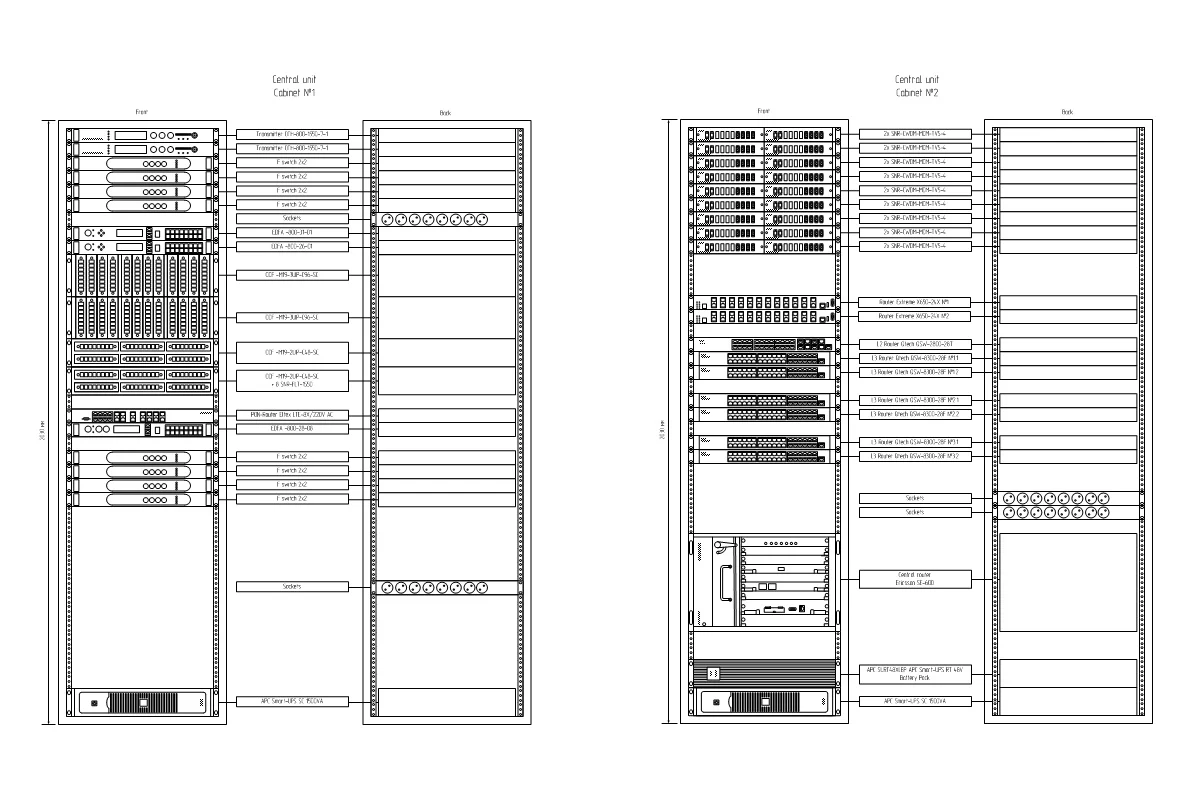
Rack design
Draw a cabinet, put the rack equipment in. Boom! Rack design is complete. Does on need to use detailed stencils of every piece of equipment in the cabinet? Well, not necessarily. It’s completely ok to use stencils provided by the vendor. They are nice and very detailed, your rack diagram will look very nice. But only if you can maintain the same level of detail across all of the equipment in this cabinet. Do you have the stencils for UPS, distribution frames, cable organizers, with the same level of detail as your Cisco stencils? No? Then make it simple yet readable.
Also, a rack diagram is not complete without the cabinet dimensions and rack denotement. If you’re installing a new equipment into an existing cabinet – make the equipment’s outline thicker, add a text note that it is new. If you’re planning to uninstall some equipment – show it striked out (add a text note too).
Rack design isn’t complete without a rack connection diagram – a list of all new connections, enumerating cable types, their lengths, where from and where to.
PON design
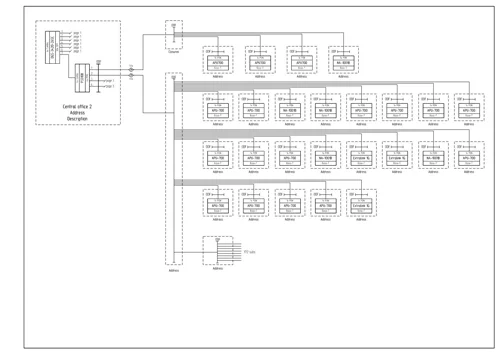
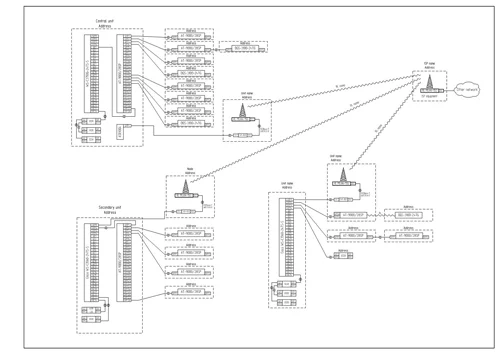
PON design should consist of at least two diagrams. The first one should be of the same detail level, as the overall network architecture diagram, and show all of the network sites with their exact addresses, all PON equipment with it’s interfaces, and all the connections. The second one serves only for calculation purposes, so it does not need that level of detail and can be much more abstract, but it must show the initial OLT signal gain, the final signal gain on all ONT endpoints, and all of the splitter details. In case you are using uneven 3-window FBT optical splitters – the diagram must show all of the corresponding splitter ratios. Read more about PON design.
Bon ton is to also show on the diagram:
- ONT’s allowable gain range;
- the delta between the highest and lowest gains on ONTs, and ensure it’s within 1,5-2dB range;
- the number of ONTs at each OLT’s port to unsure it’s within OLT’s allowed split ration;
- a list of used splitter types with quantities, say a mini BoQ for splitters.
Always make these PON diagrams readable. Group ONTs into clusters according to their locations, make understandable how are they distributed through OLT ports. It means the diagrams should be instantly clear to a person when viewed from afar.


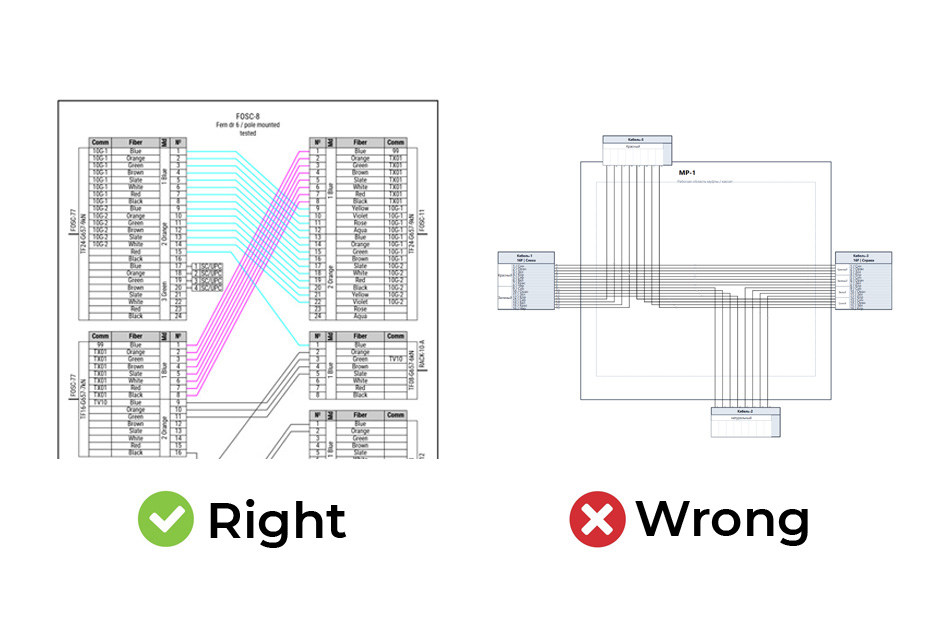
Splice charts
Congratulations, you’ve made it this far. How do you call it?
– splice chart
– splice diagram
– splice matrix
– splice sheet
– splice table
– splice report
– splice scheme
– splice cut sheet
I have tons of these diagrams, from neat to extremely ugly. But today you don’t need to draw it by hand. Use the app.
Move on? Become a certified fiber network designer
Also learn more about fiber networks and the right of way
More of that, splice.me company proposes a new golden rule for splice diagrams – TIA-599